Featured Listings
Calgary Market Report Infographics
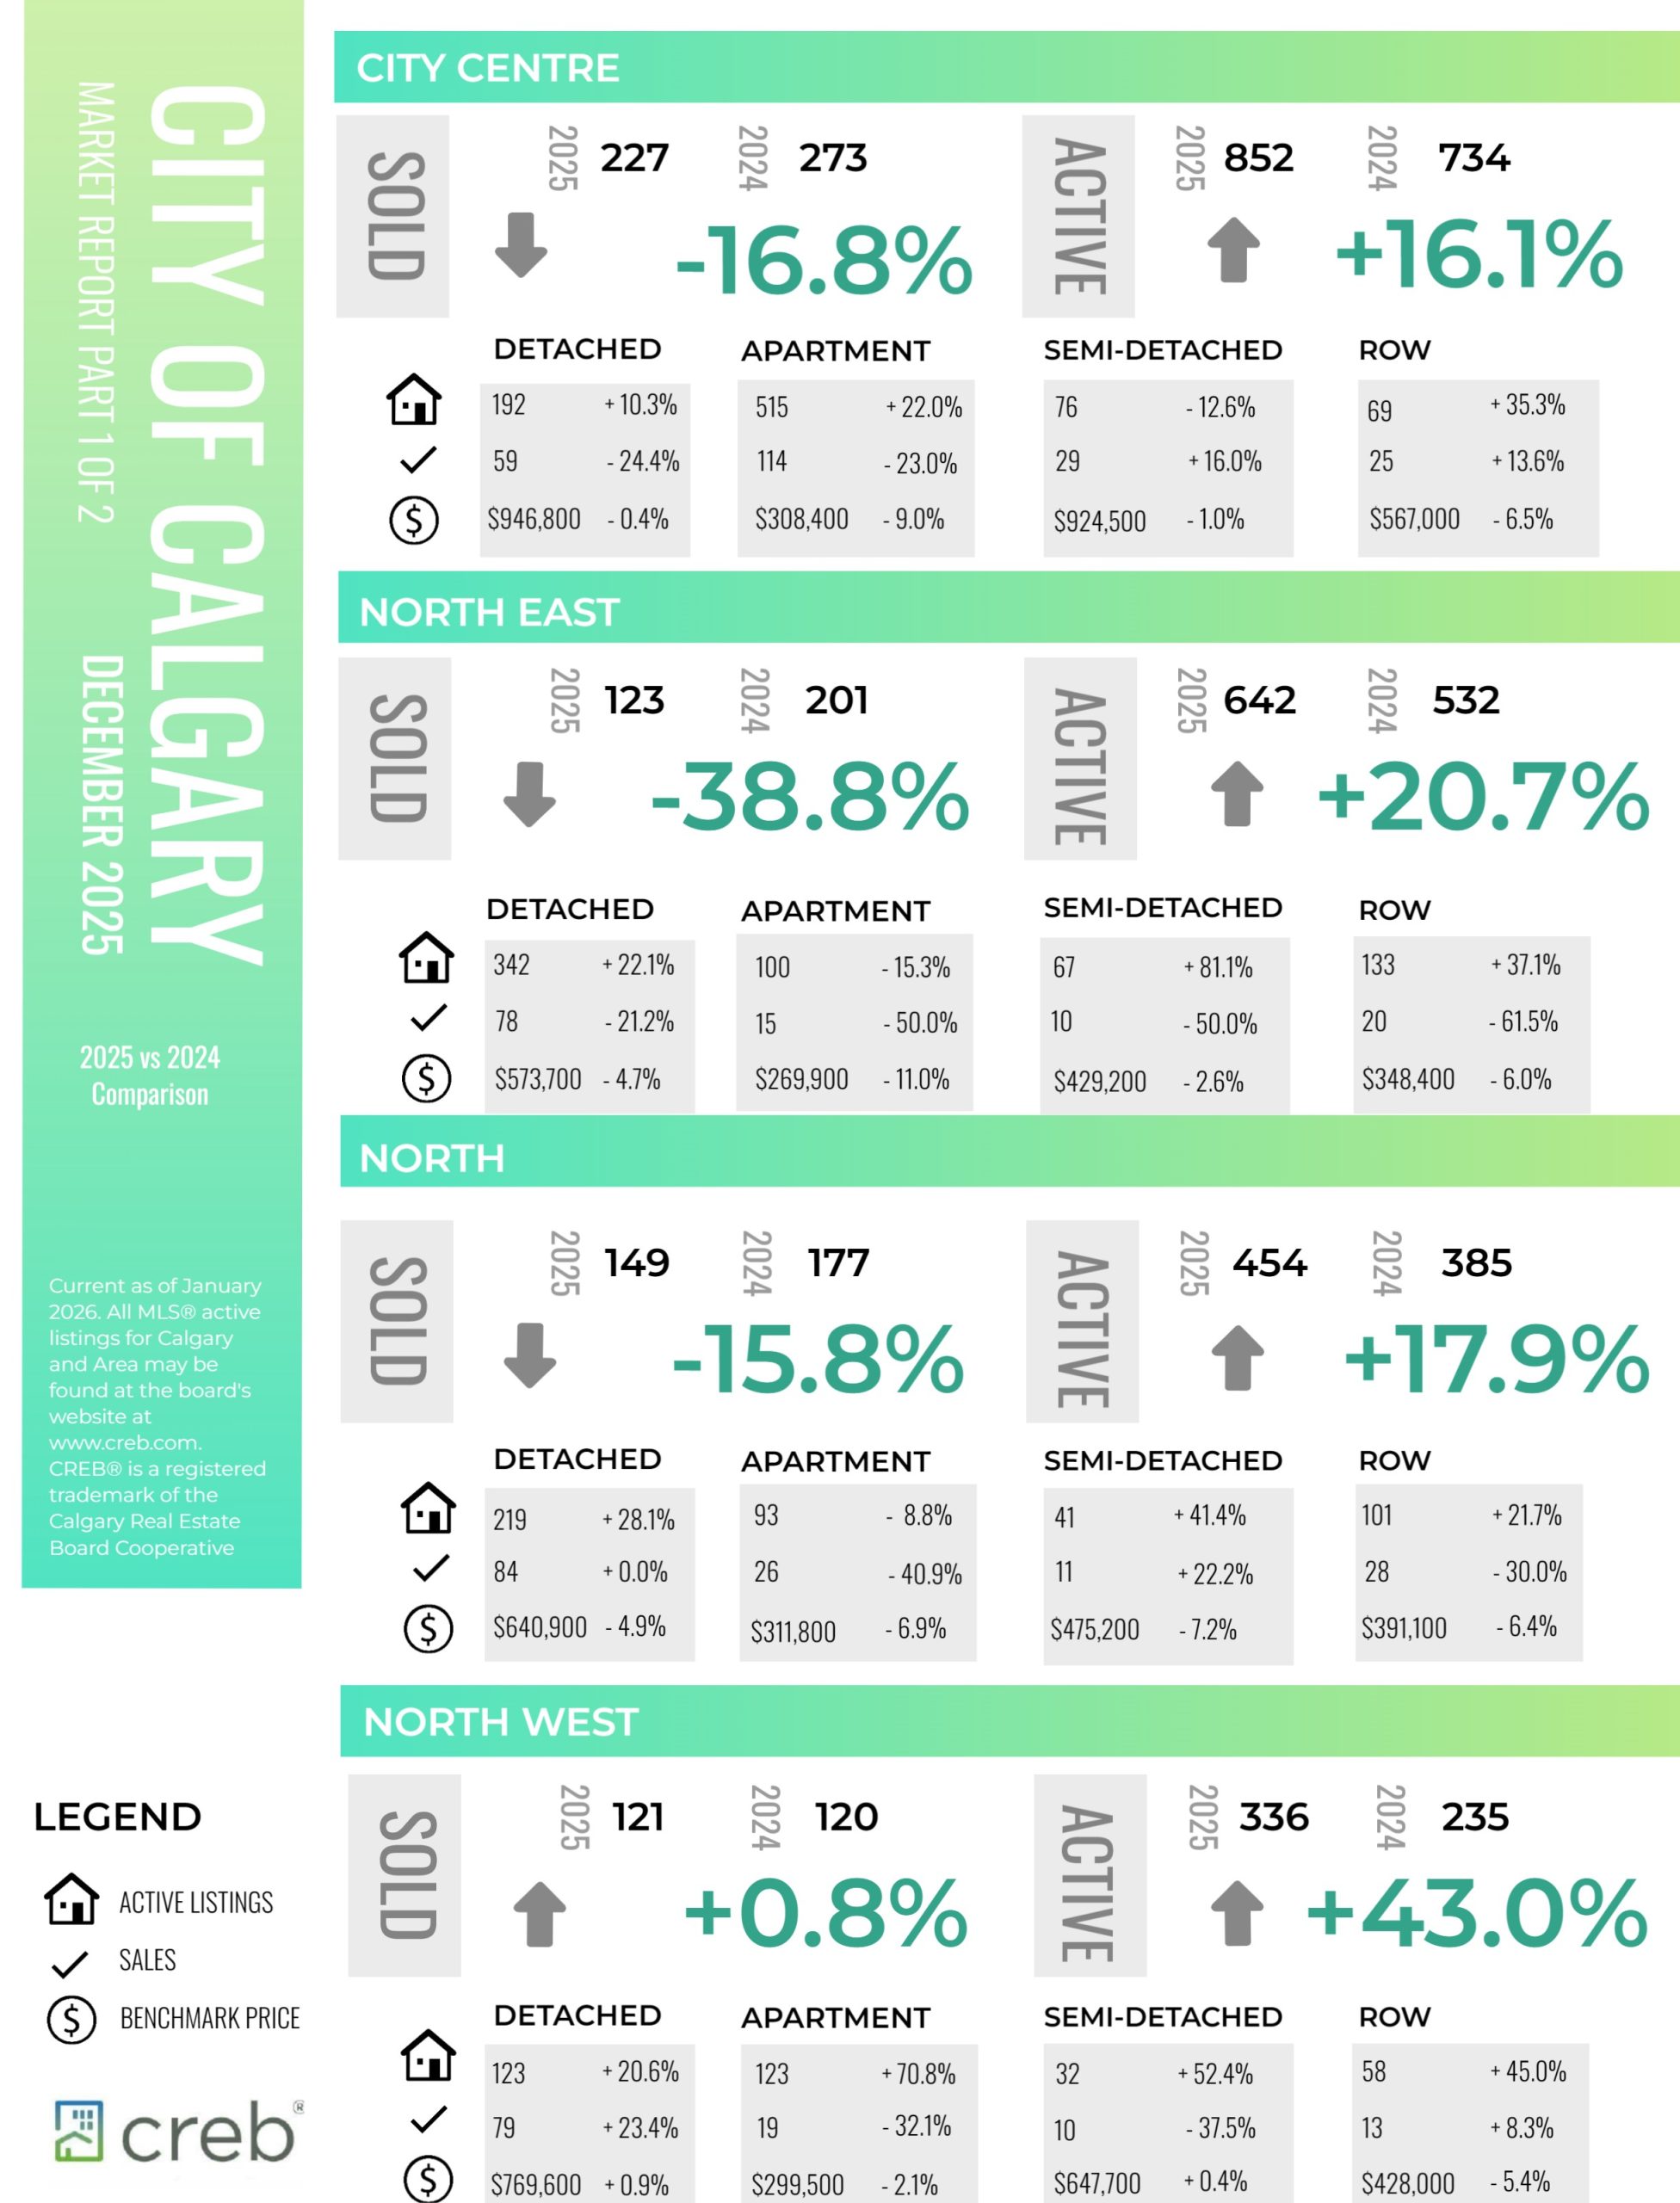
INFOGRAPHICS: December 2025 CREB City And Region Market Reports

2025 housing market shifted to more balanced conditions
Following several years of strong price growth, 2025 marked a year of transition thanks to strong demand and limited supply. Due to record high starts, supply levels improved across all aspects of the housing market, just as demand pressure eased due to a reduction in migration levels and heightened uncertainty that persisted throughout the spring market. This helped shift the resale market from one that favoured the seller to one that was more balanced.
In 2025, sales reached 22,751 units, down 16 per cent over last year, but in-line with long-term trends. Much of the shift came from the growth in supply. 2025 saw over 40,000 new listings come onto the market, nine per cent higher than last year, causing inventories to rise and driving more balanced conditions.
“Supply levels were expected to rise in 2025. However, the growth was higher than expected especially for apartment condominium and row homes. This weighed on prices in those sectors enough to offset the annual gains reported for both detached and semi-detached homes,” said Ann-Marie Lurie, CREB®’s Chief Economist. “Adjustments in both supply and demand varied across the city, with pockets of the market continuing to experience seller’s market conditions versus some areas where the conditions favoured the buyer. This resulted in different price trends based on location, price range and property type.”
Read the full report on the CREB website!
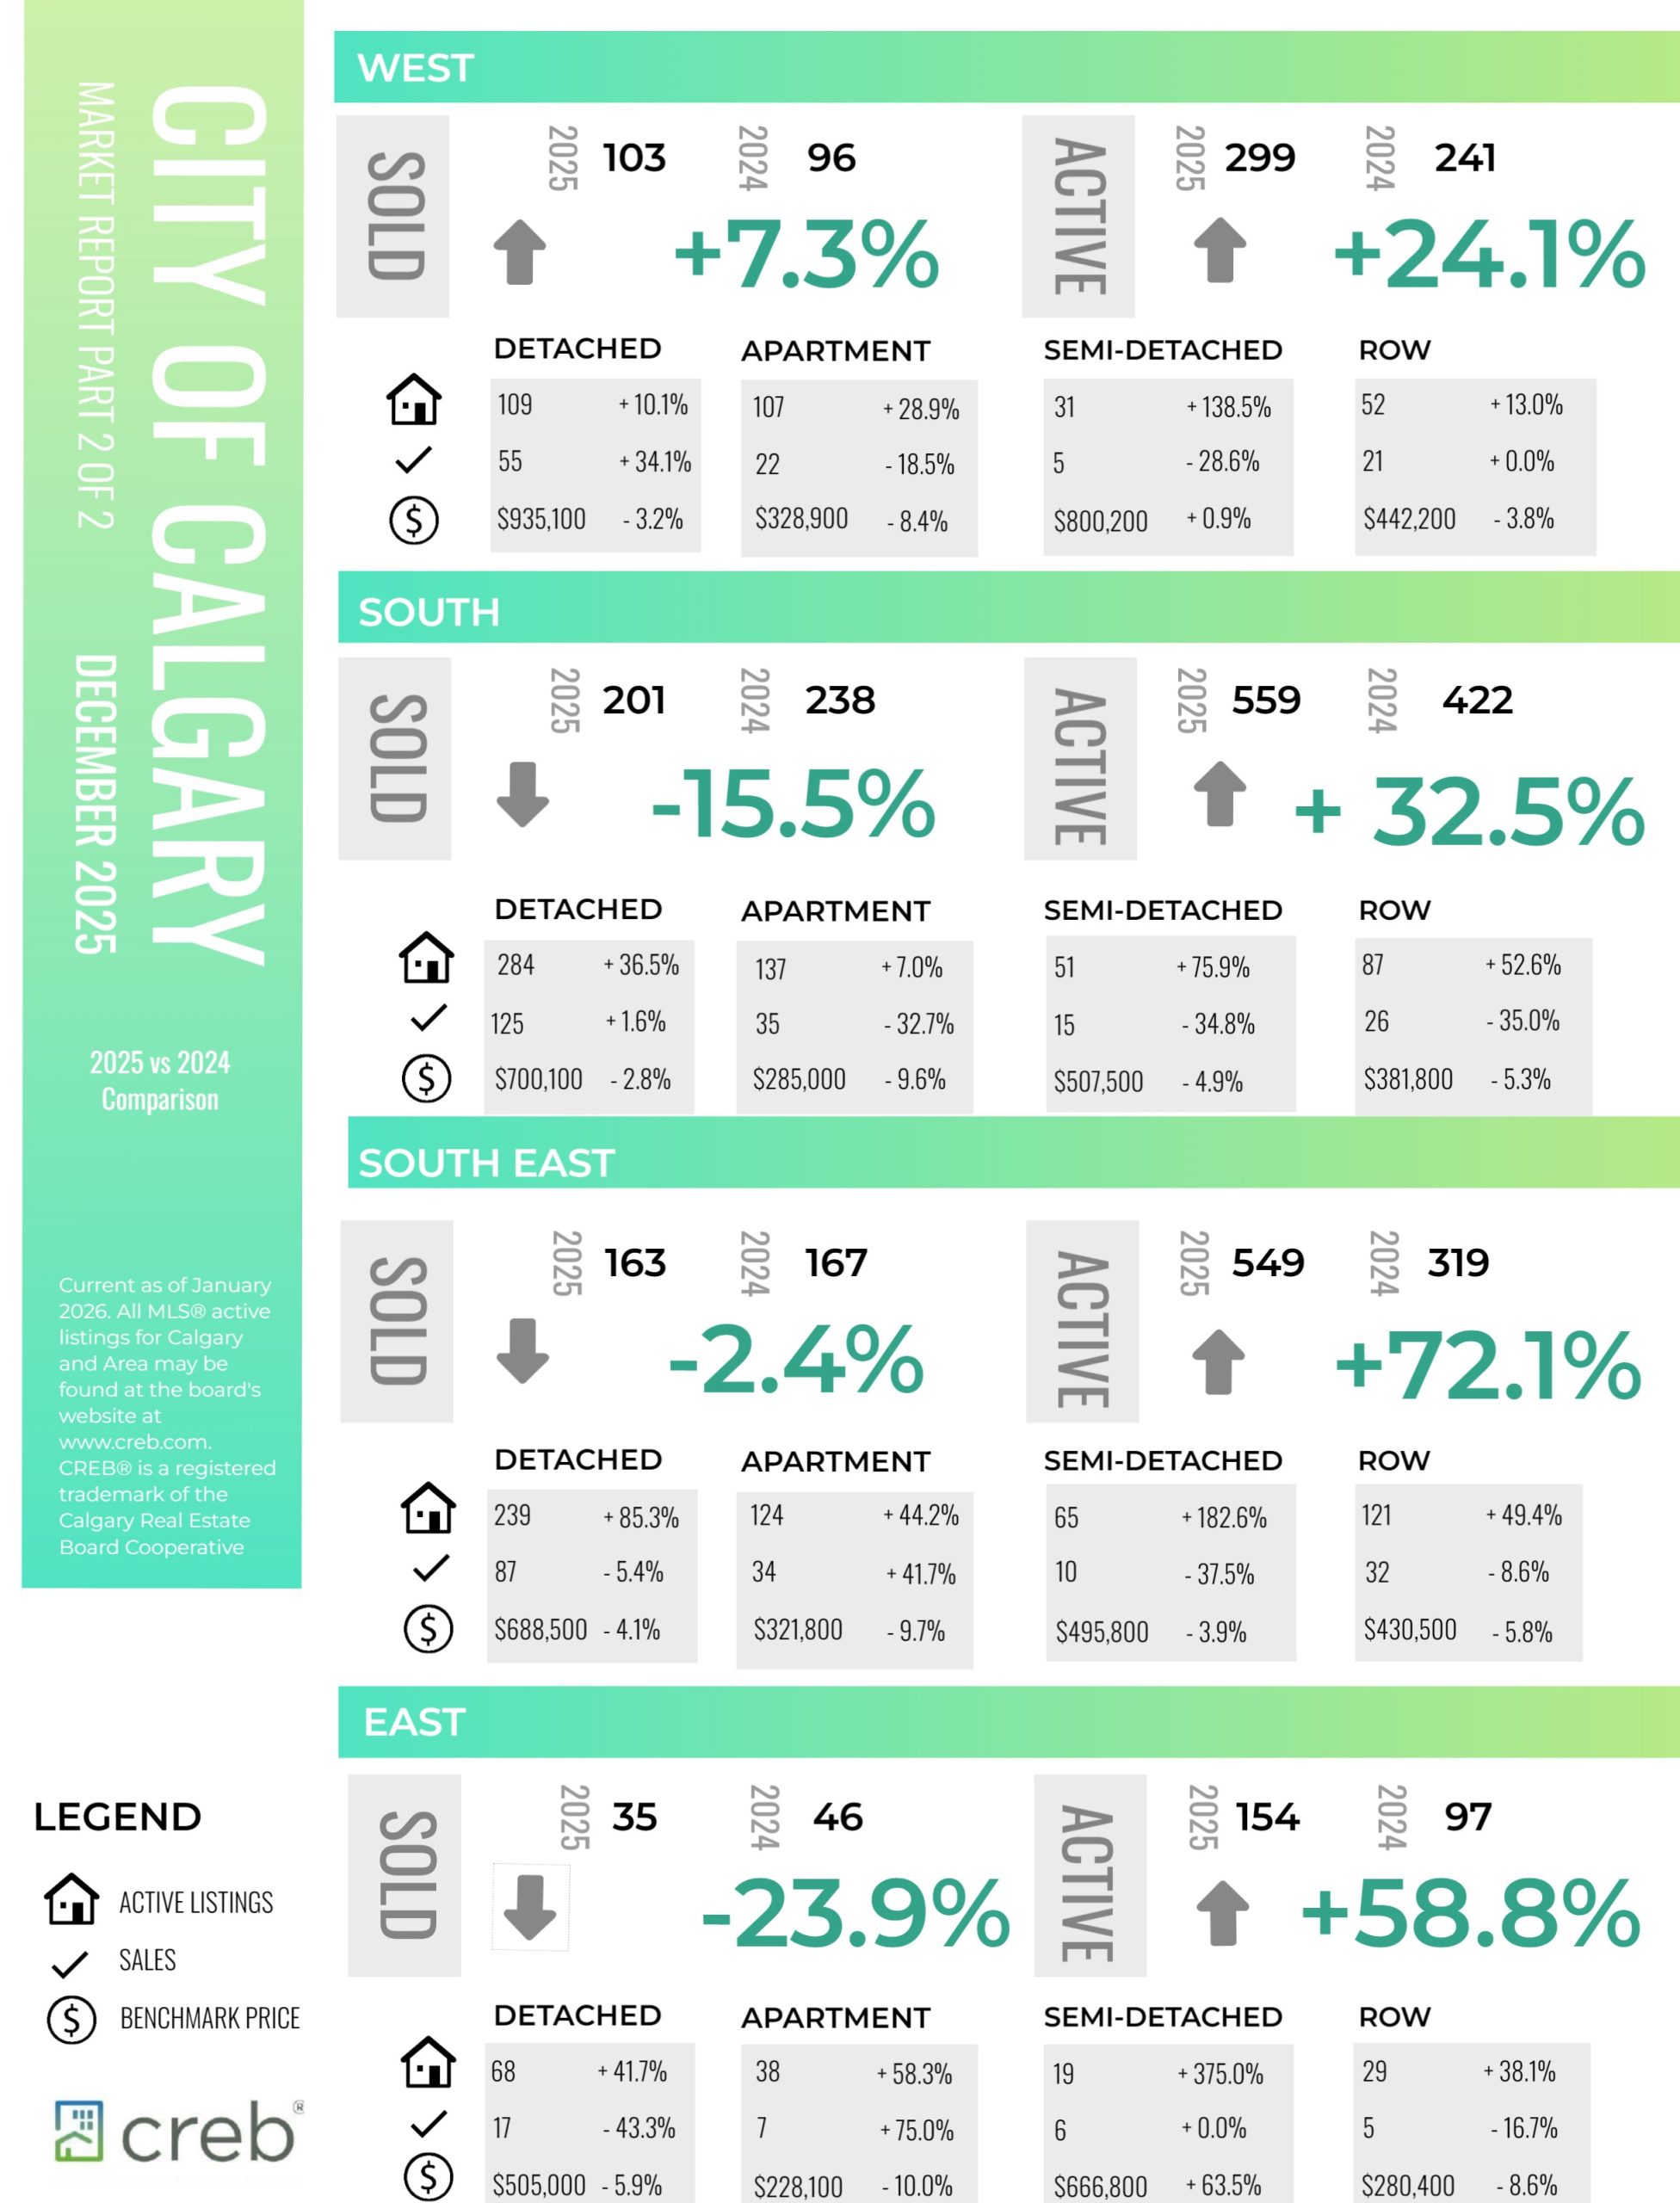
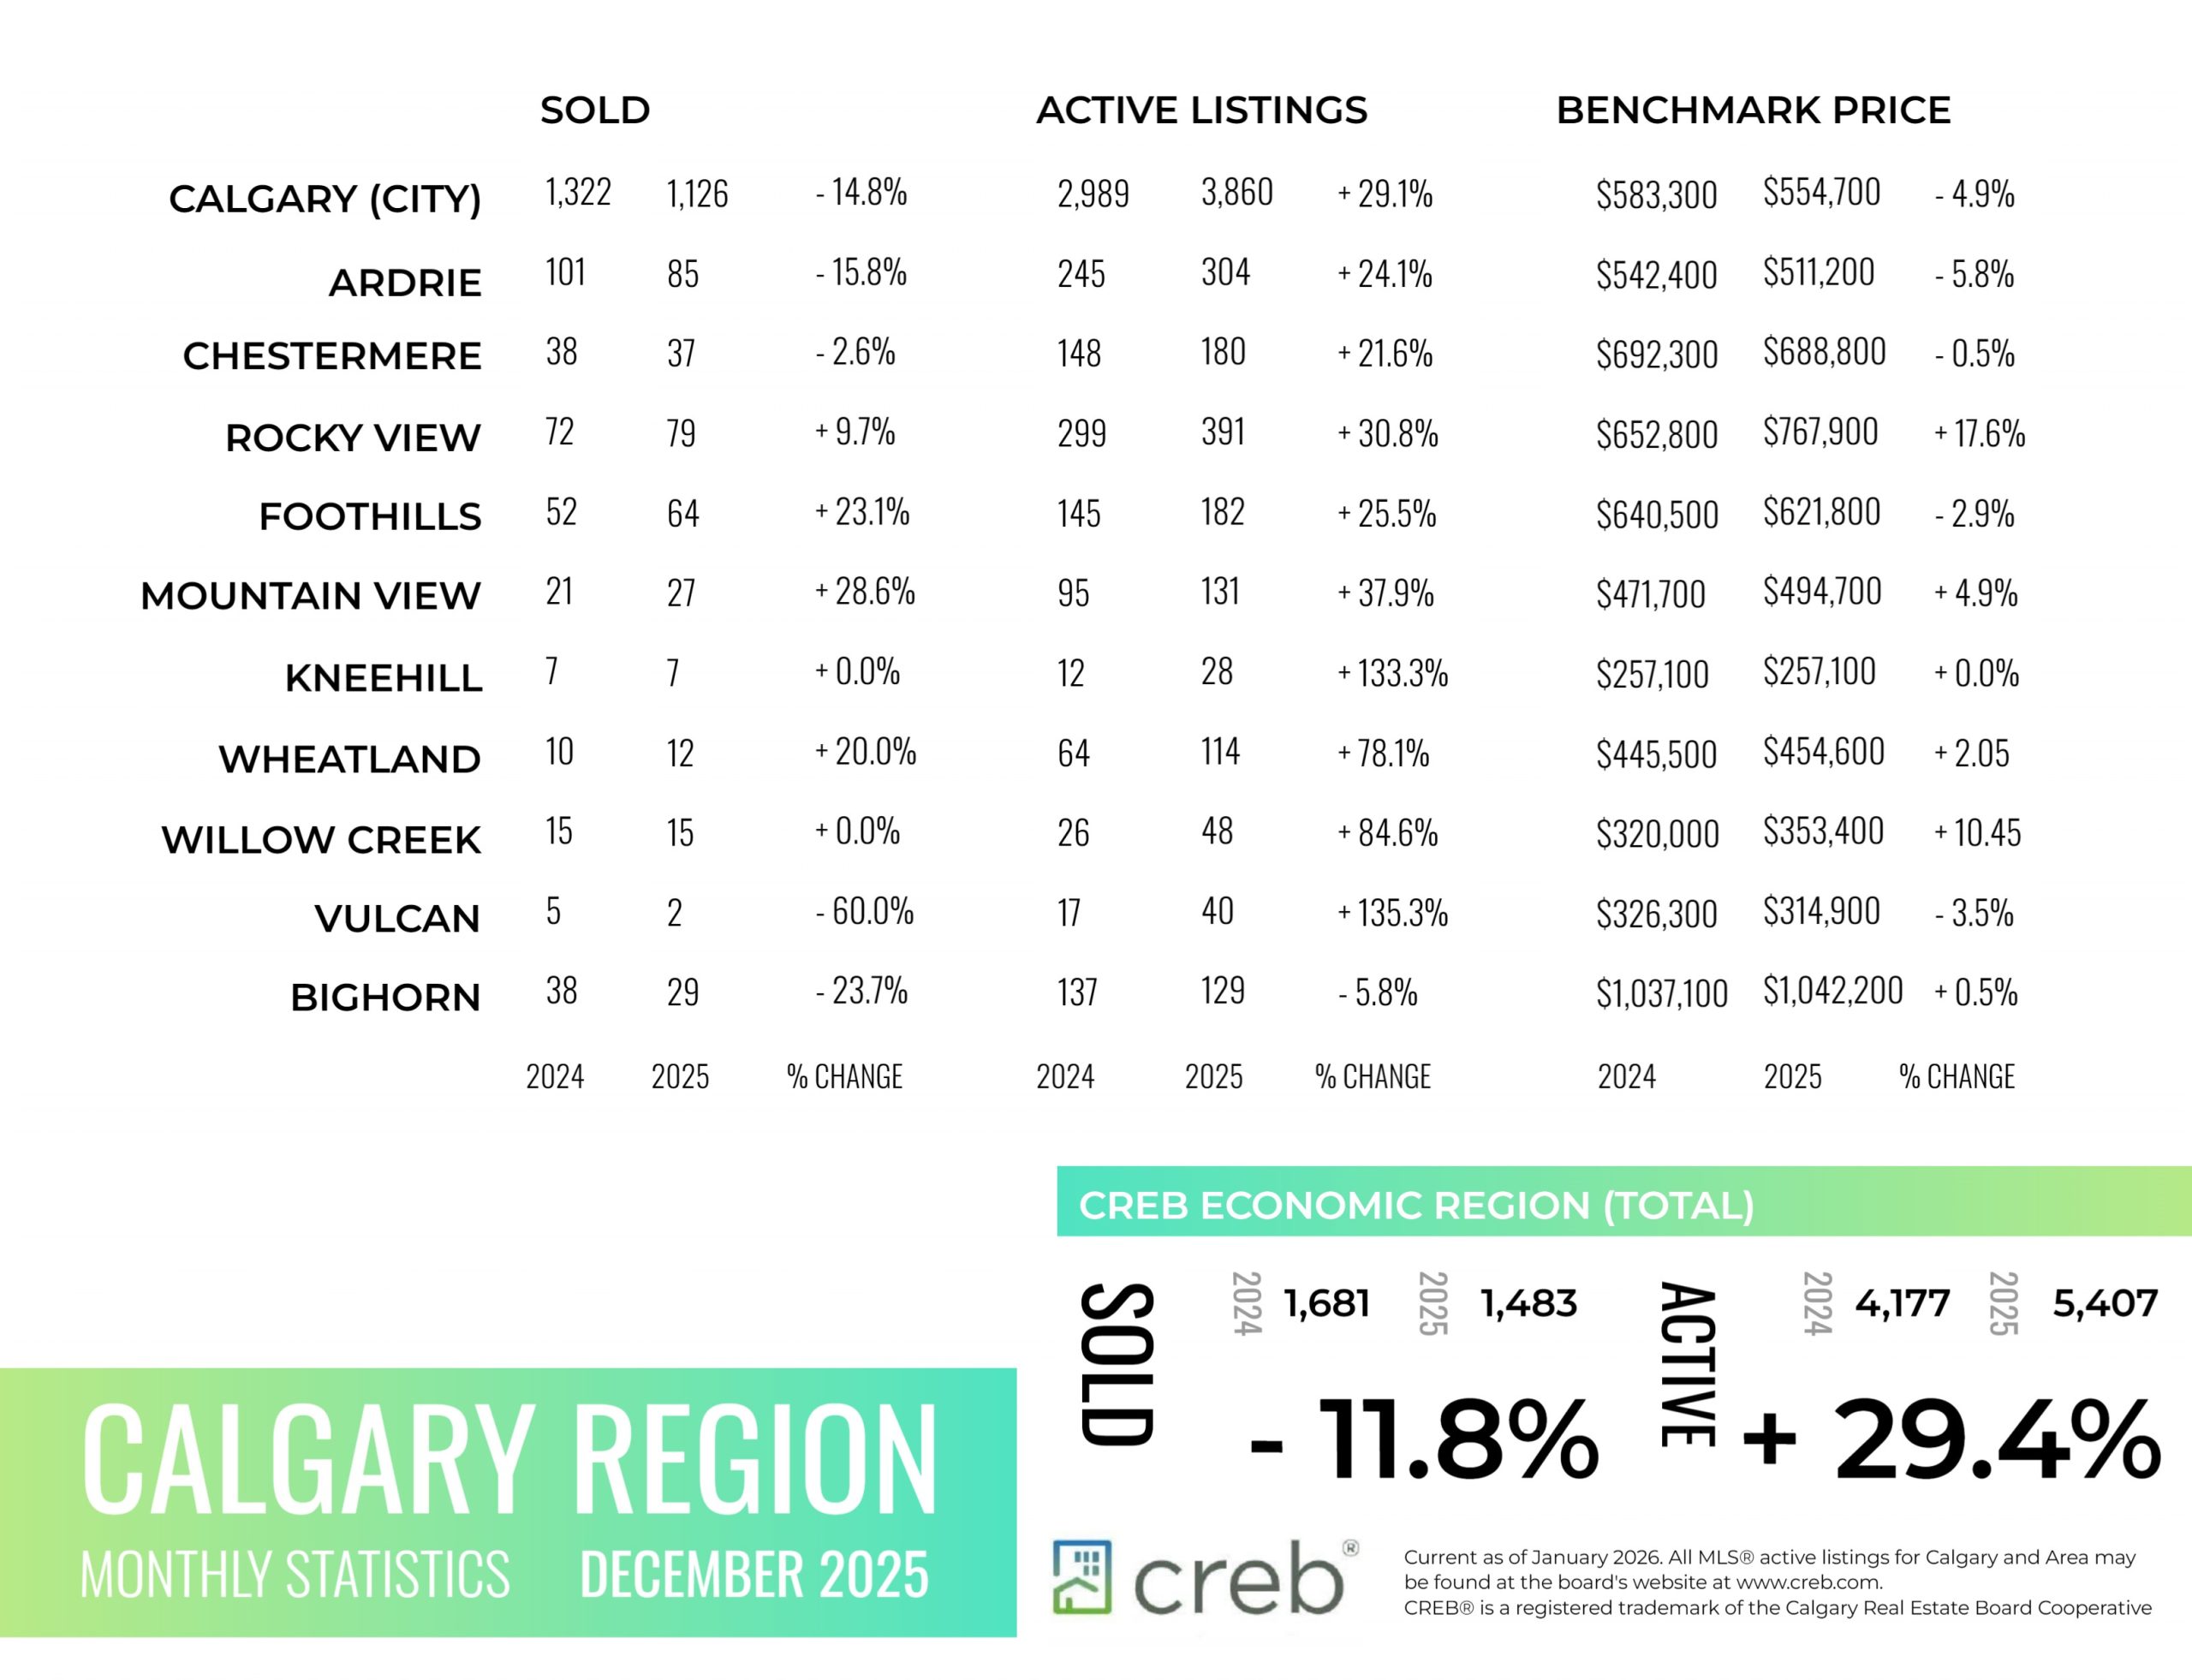
The following data is a comparison between December 2025 and December 2024 numbers, and is current as of January of 2026. For last month’s numbers, check out our previous infographic.
Or follow this link for all our CREB Infographics!
Click on the images for a larger view!
Download Printable Version – December 2025 CREB, City of Calgary Report Pages 1 and 2
Download Printable Version – December 2025 CREB, Calgary Region Report
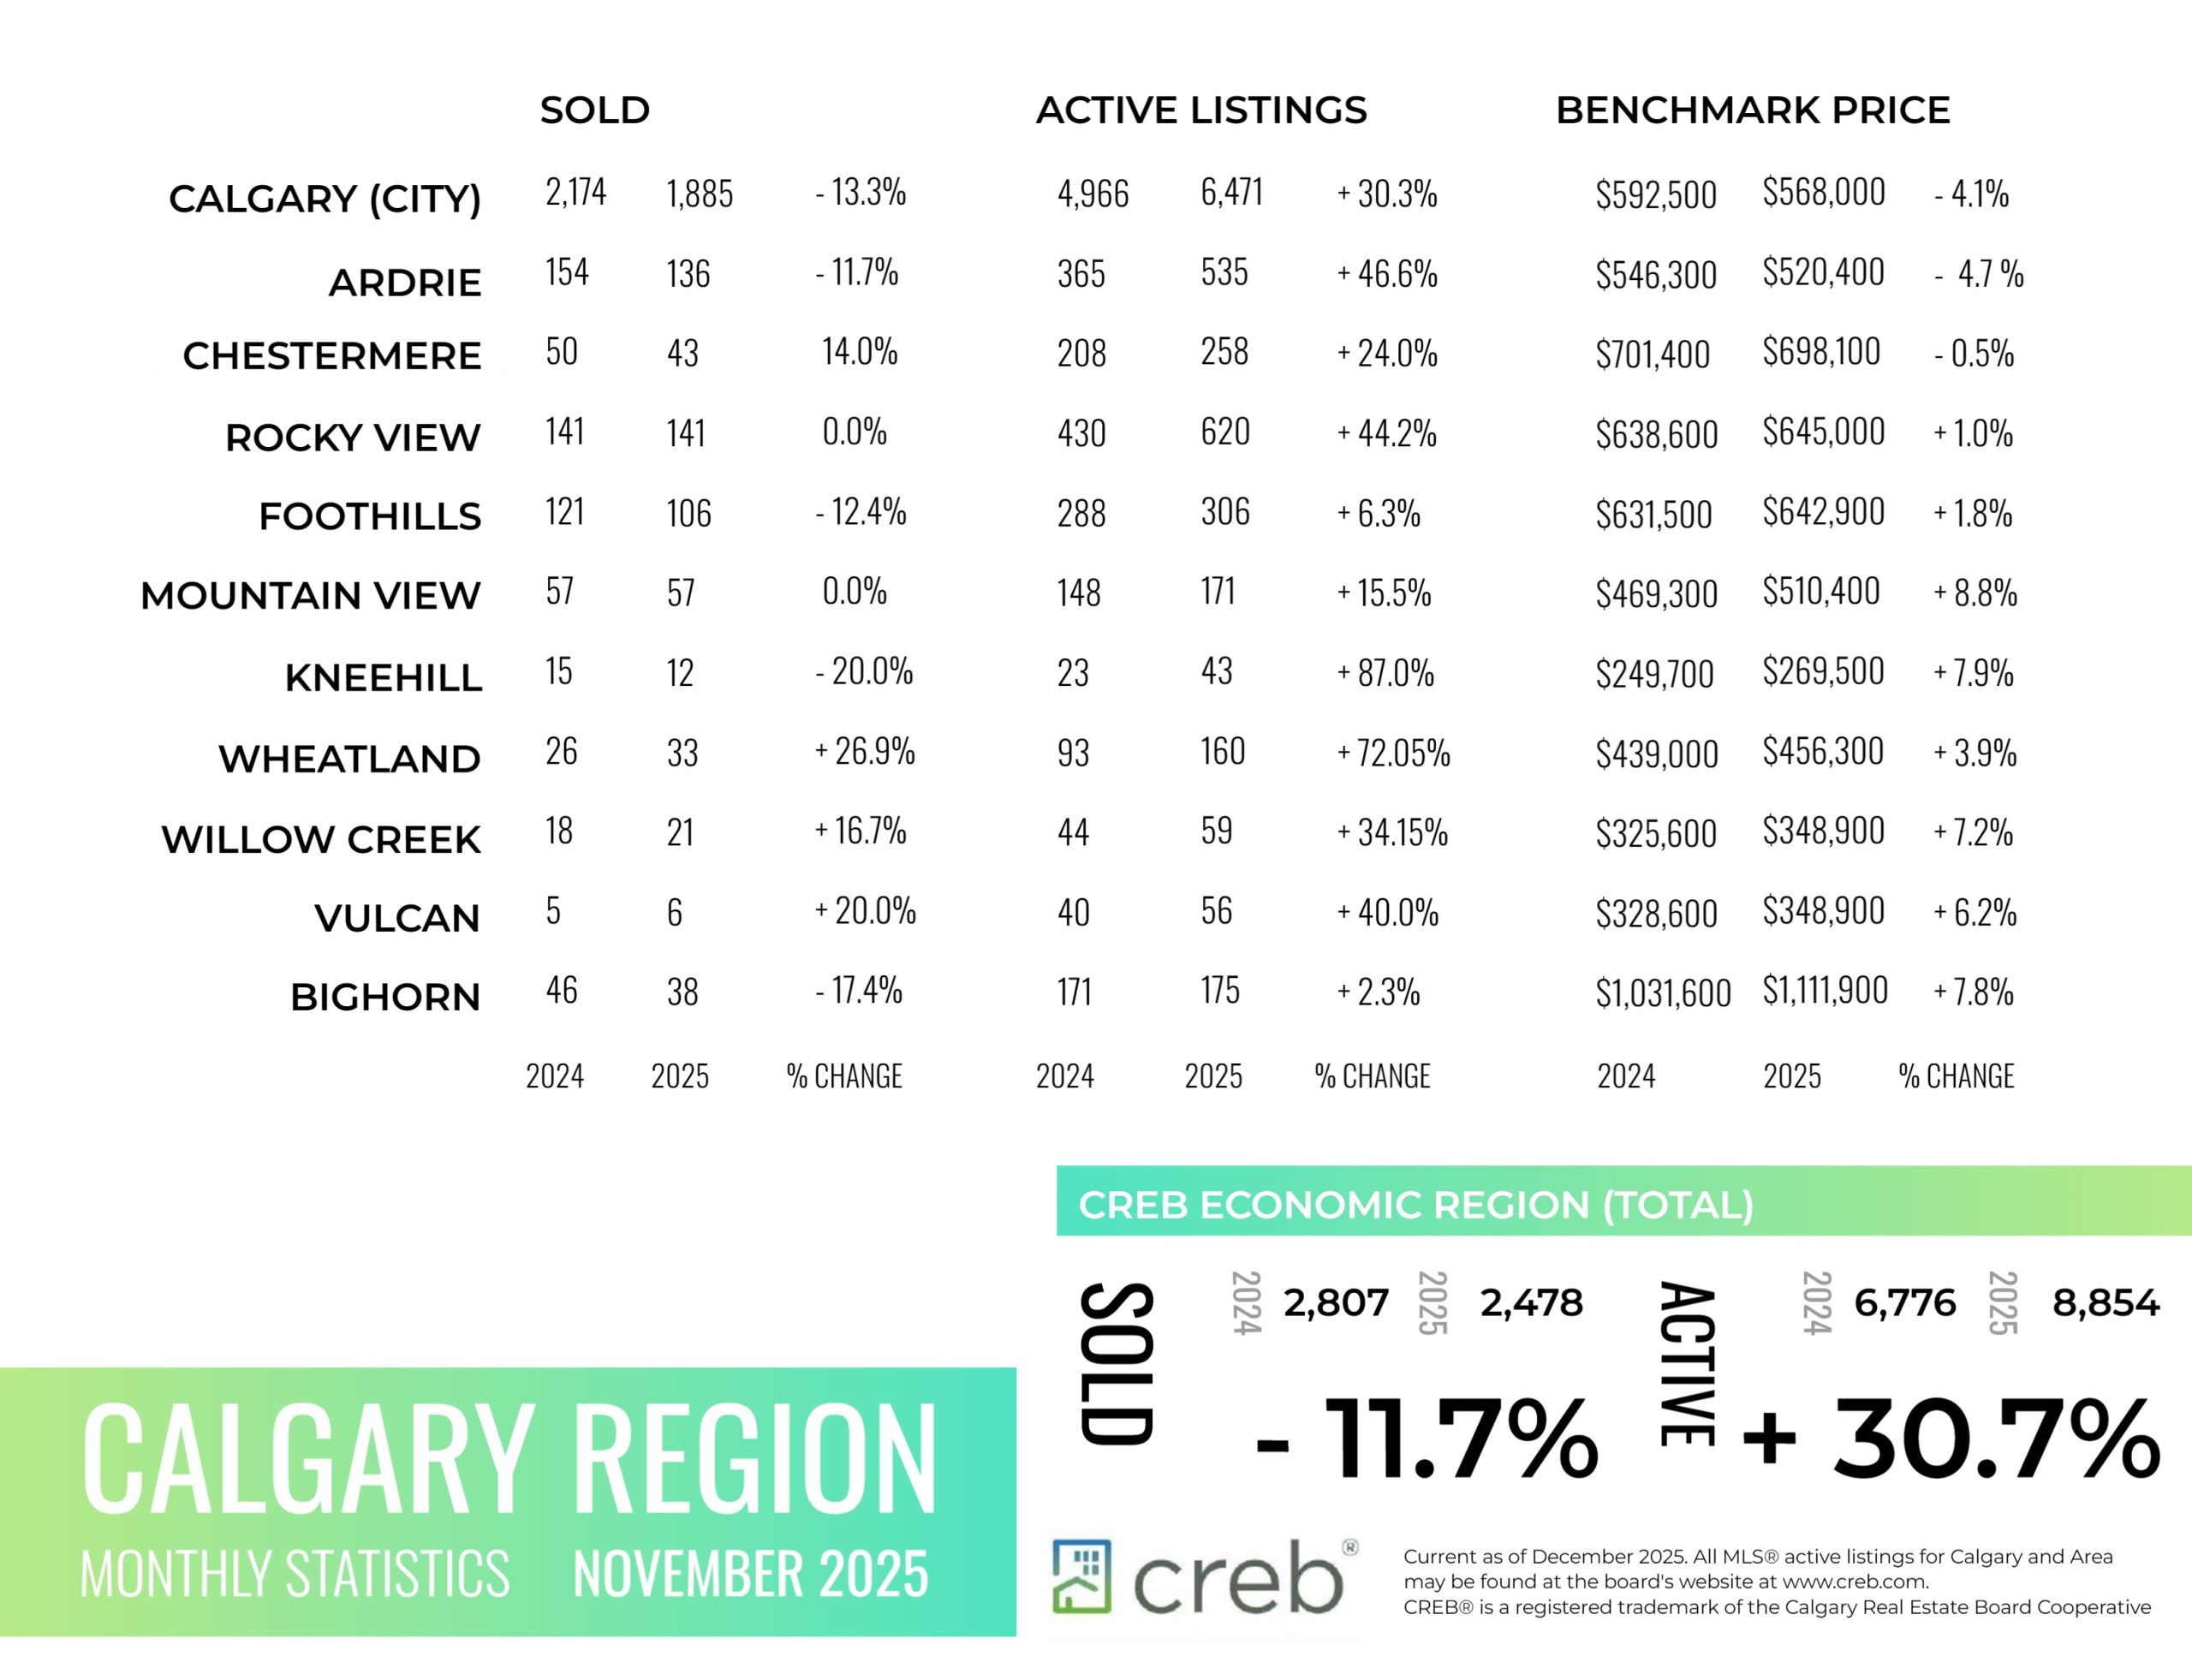
INFOGRAPHICS: November 2025 CREB City And Region Market Reports

Pace of new listings growth slows, preventing further inventory gains
Inventory levels eased over last month thanks to the combined impact of a monthly pullback in new listings and a monthly pick up in sales.
With 6,471 units in inventory and 1,885 sales the October months of supply returned to three-and-a-half months after pushing up to four months in September. While both row- and apartment-style properties continue to report elevated supply levels compared to demand, conditions remain relatively balanced for both detached and semi-detached properties.
Year-to-date sales in the city totaled 20,082, down nearly 16 per cent compared to last year, but still in line with longer-term trends. Much of the decline in sales has been driven by pullbacks for apartment- and row-style homes.
“Improved rental supply and easing rents have slowed ownership demand for apartment- and row-style homes. It is also these segments of the market that have seen October inventories reach a record high for the month,” said Ann-Marie Lurie, CREB®’s Chief Economist. “Excess supply for apartment- and row-style properties is weighing on prices in those segments more so than any other property type, influencing total residential prices.”
Read the full report on the CREB website!
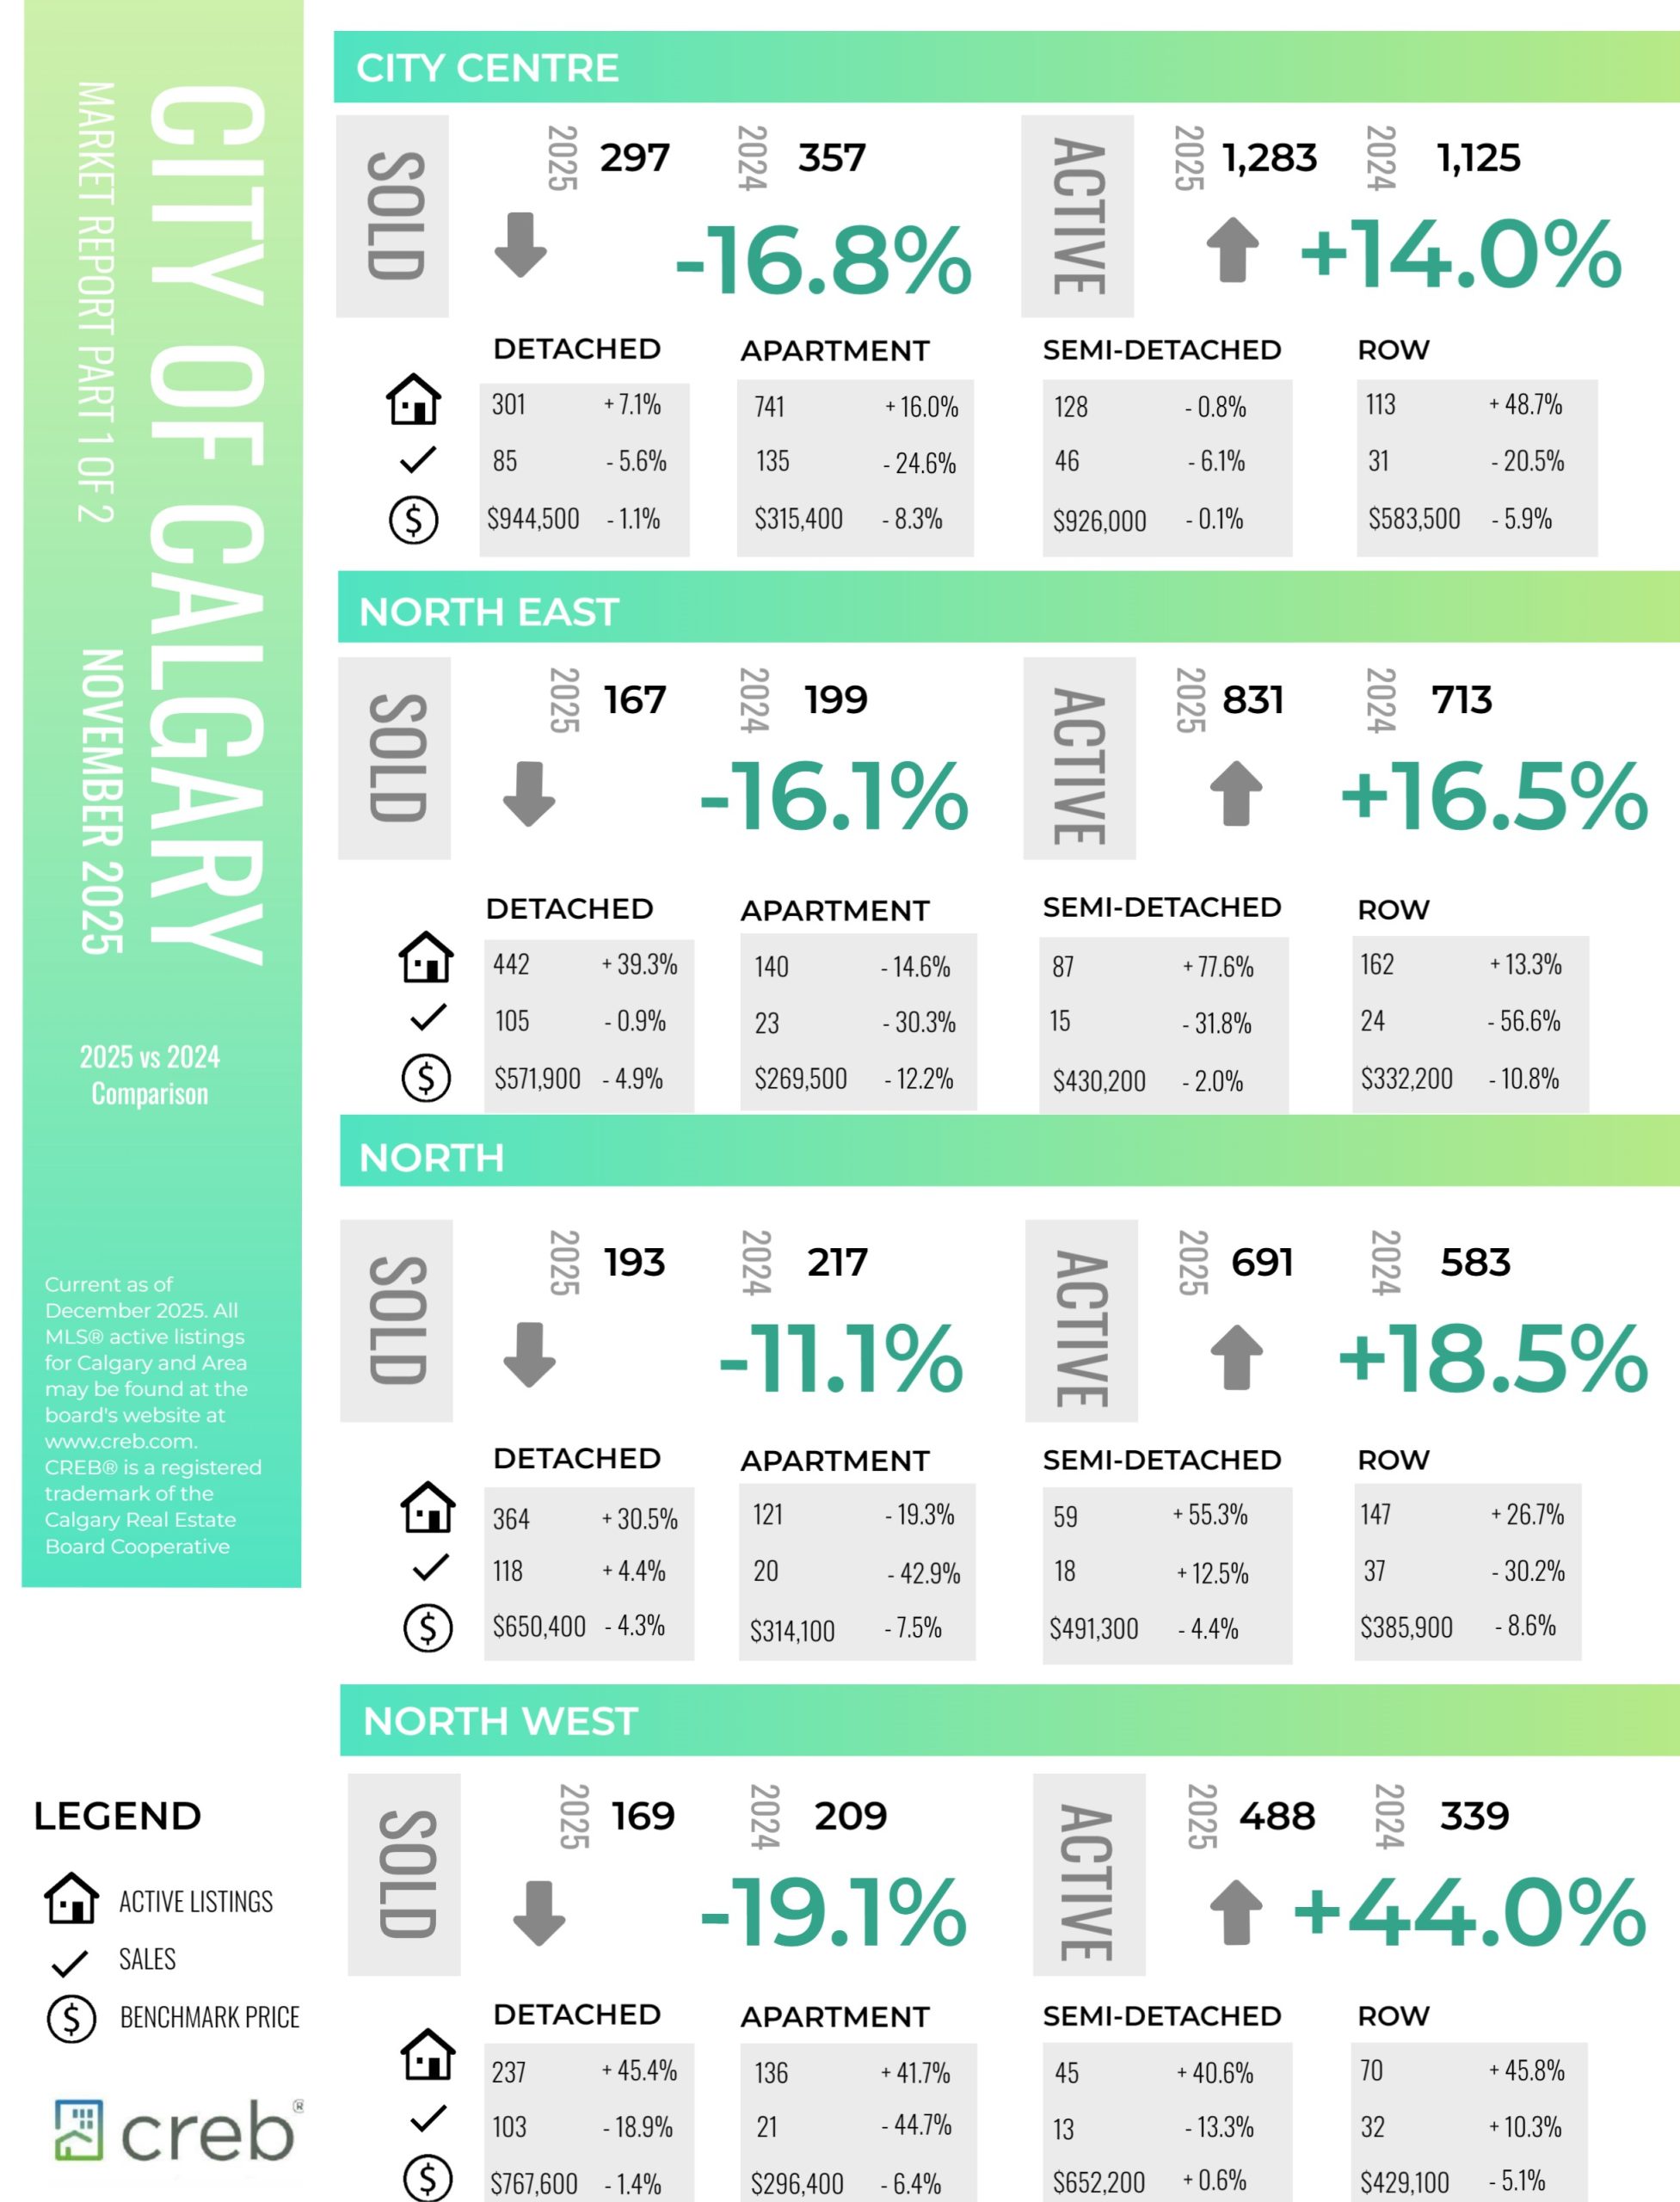
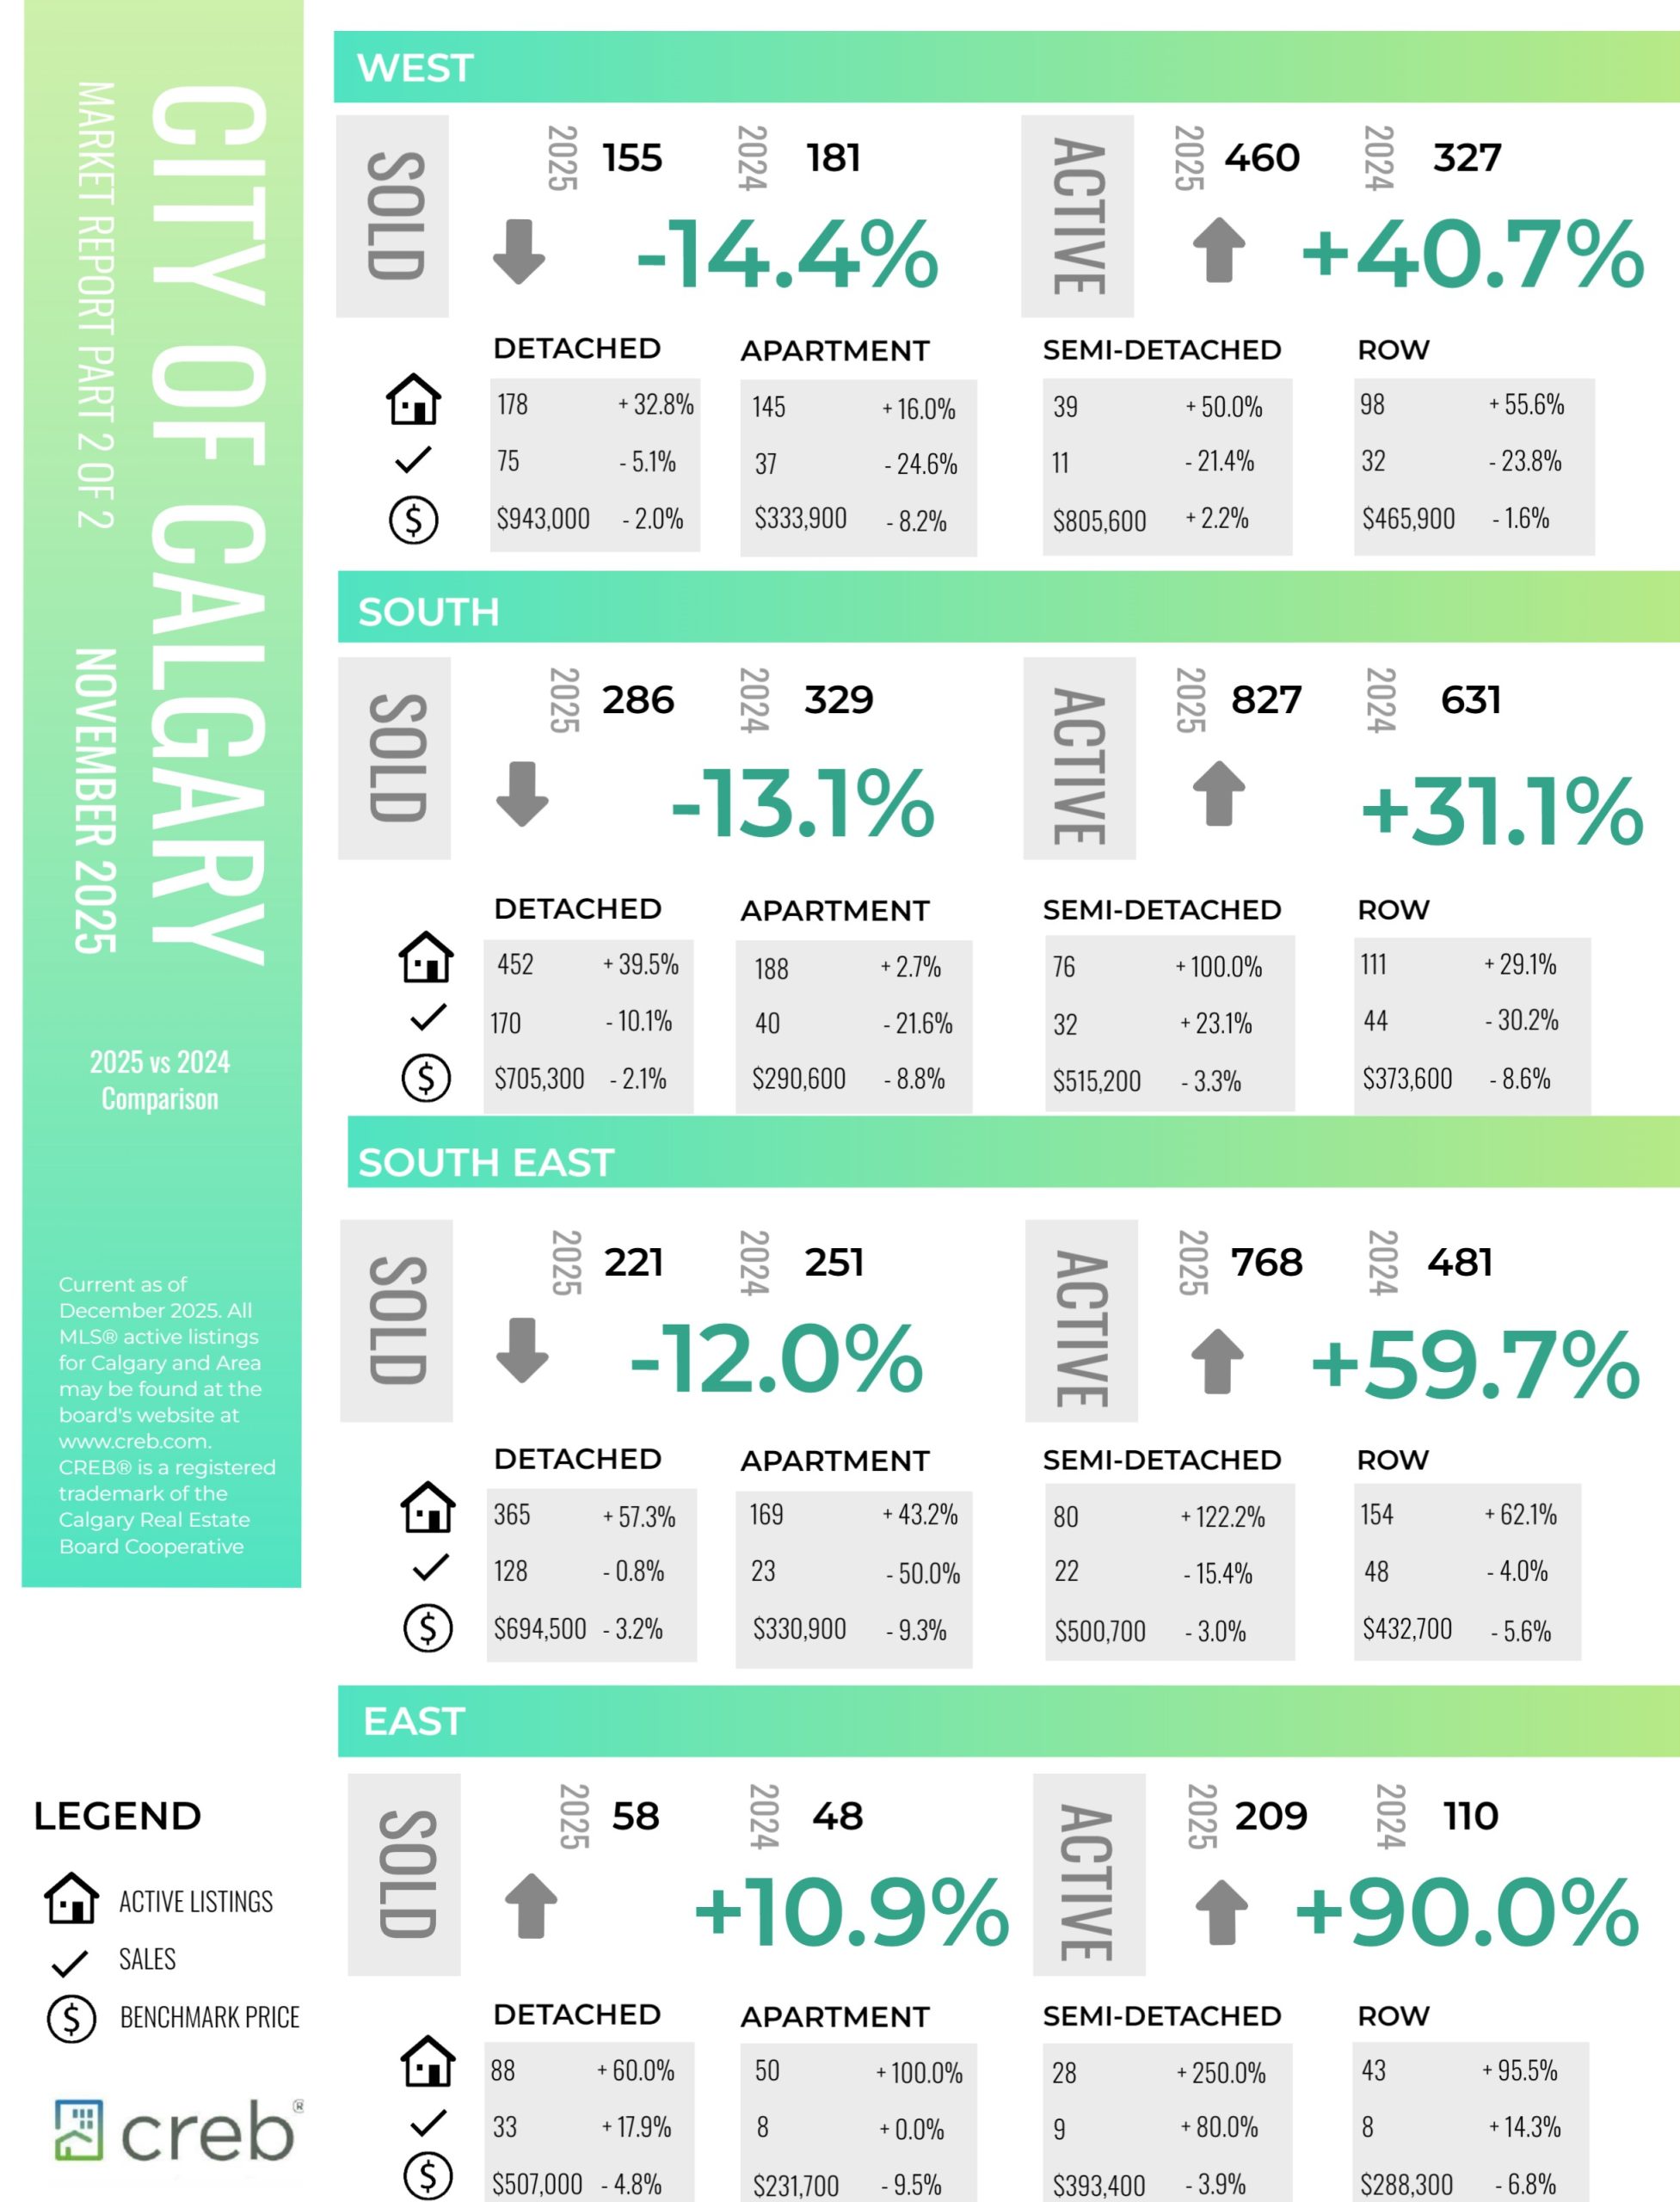
The following data is a comparison between November 2025 and November 2024 numbers, and is current as of December of 2025. For last month’s numbers, check out our previous infographic.
Or follow this link for all our CREB Infographics!
Click on the images for a larger view!
Download Printable Version – November 2025 CREB, City of Calgary Report Pages 1 and 2
Download Printable Version – November 2025 CREB, Calgary Region Report
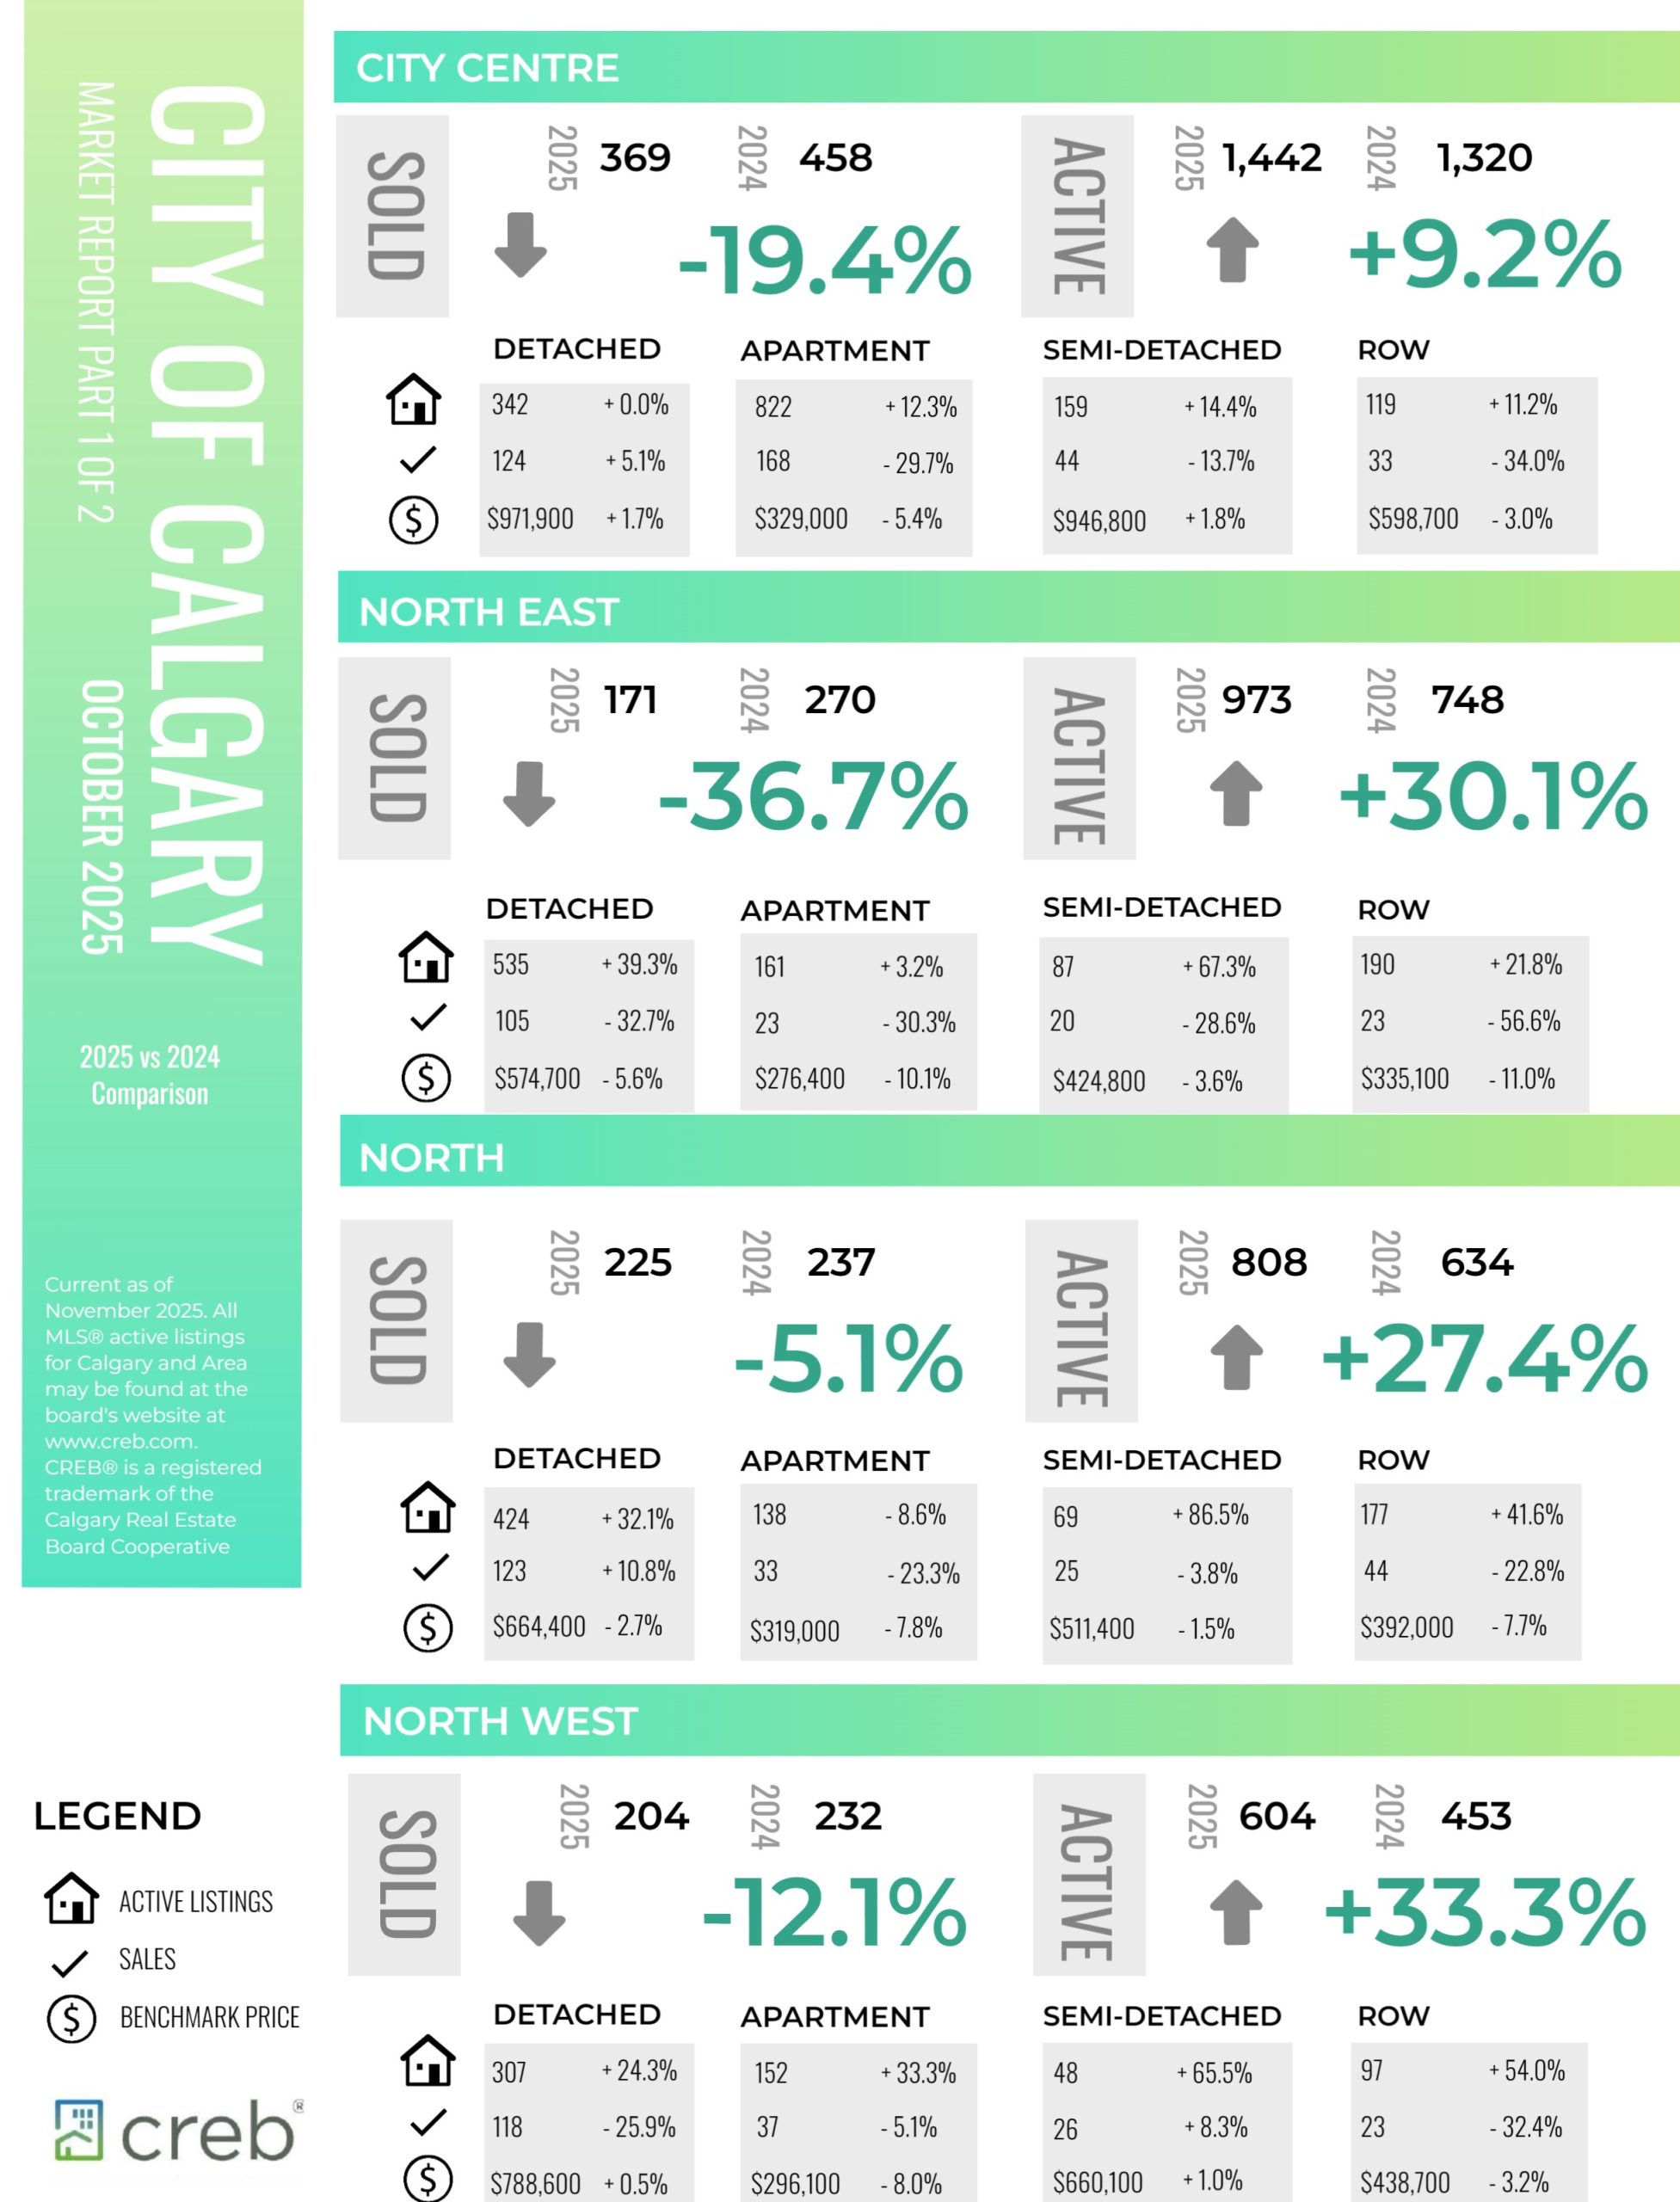
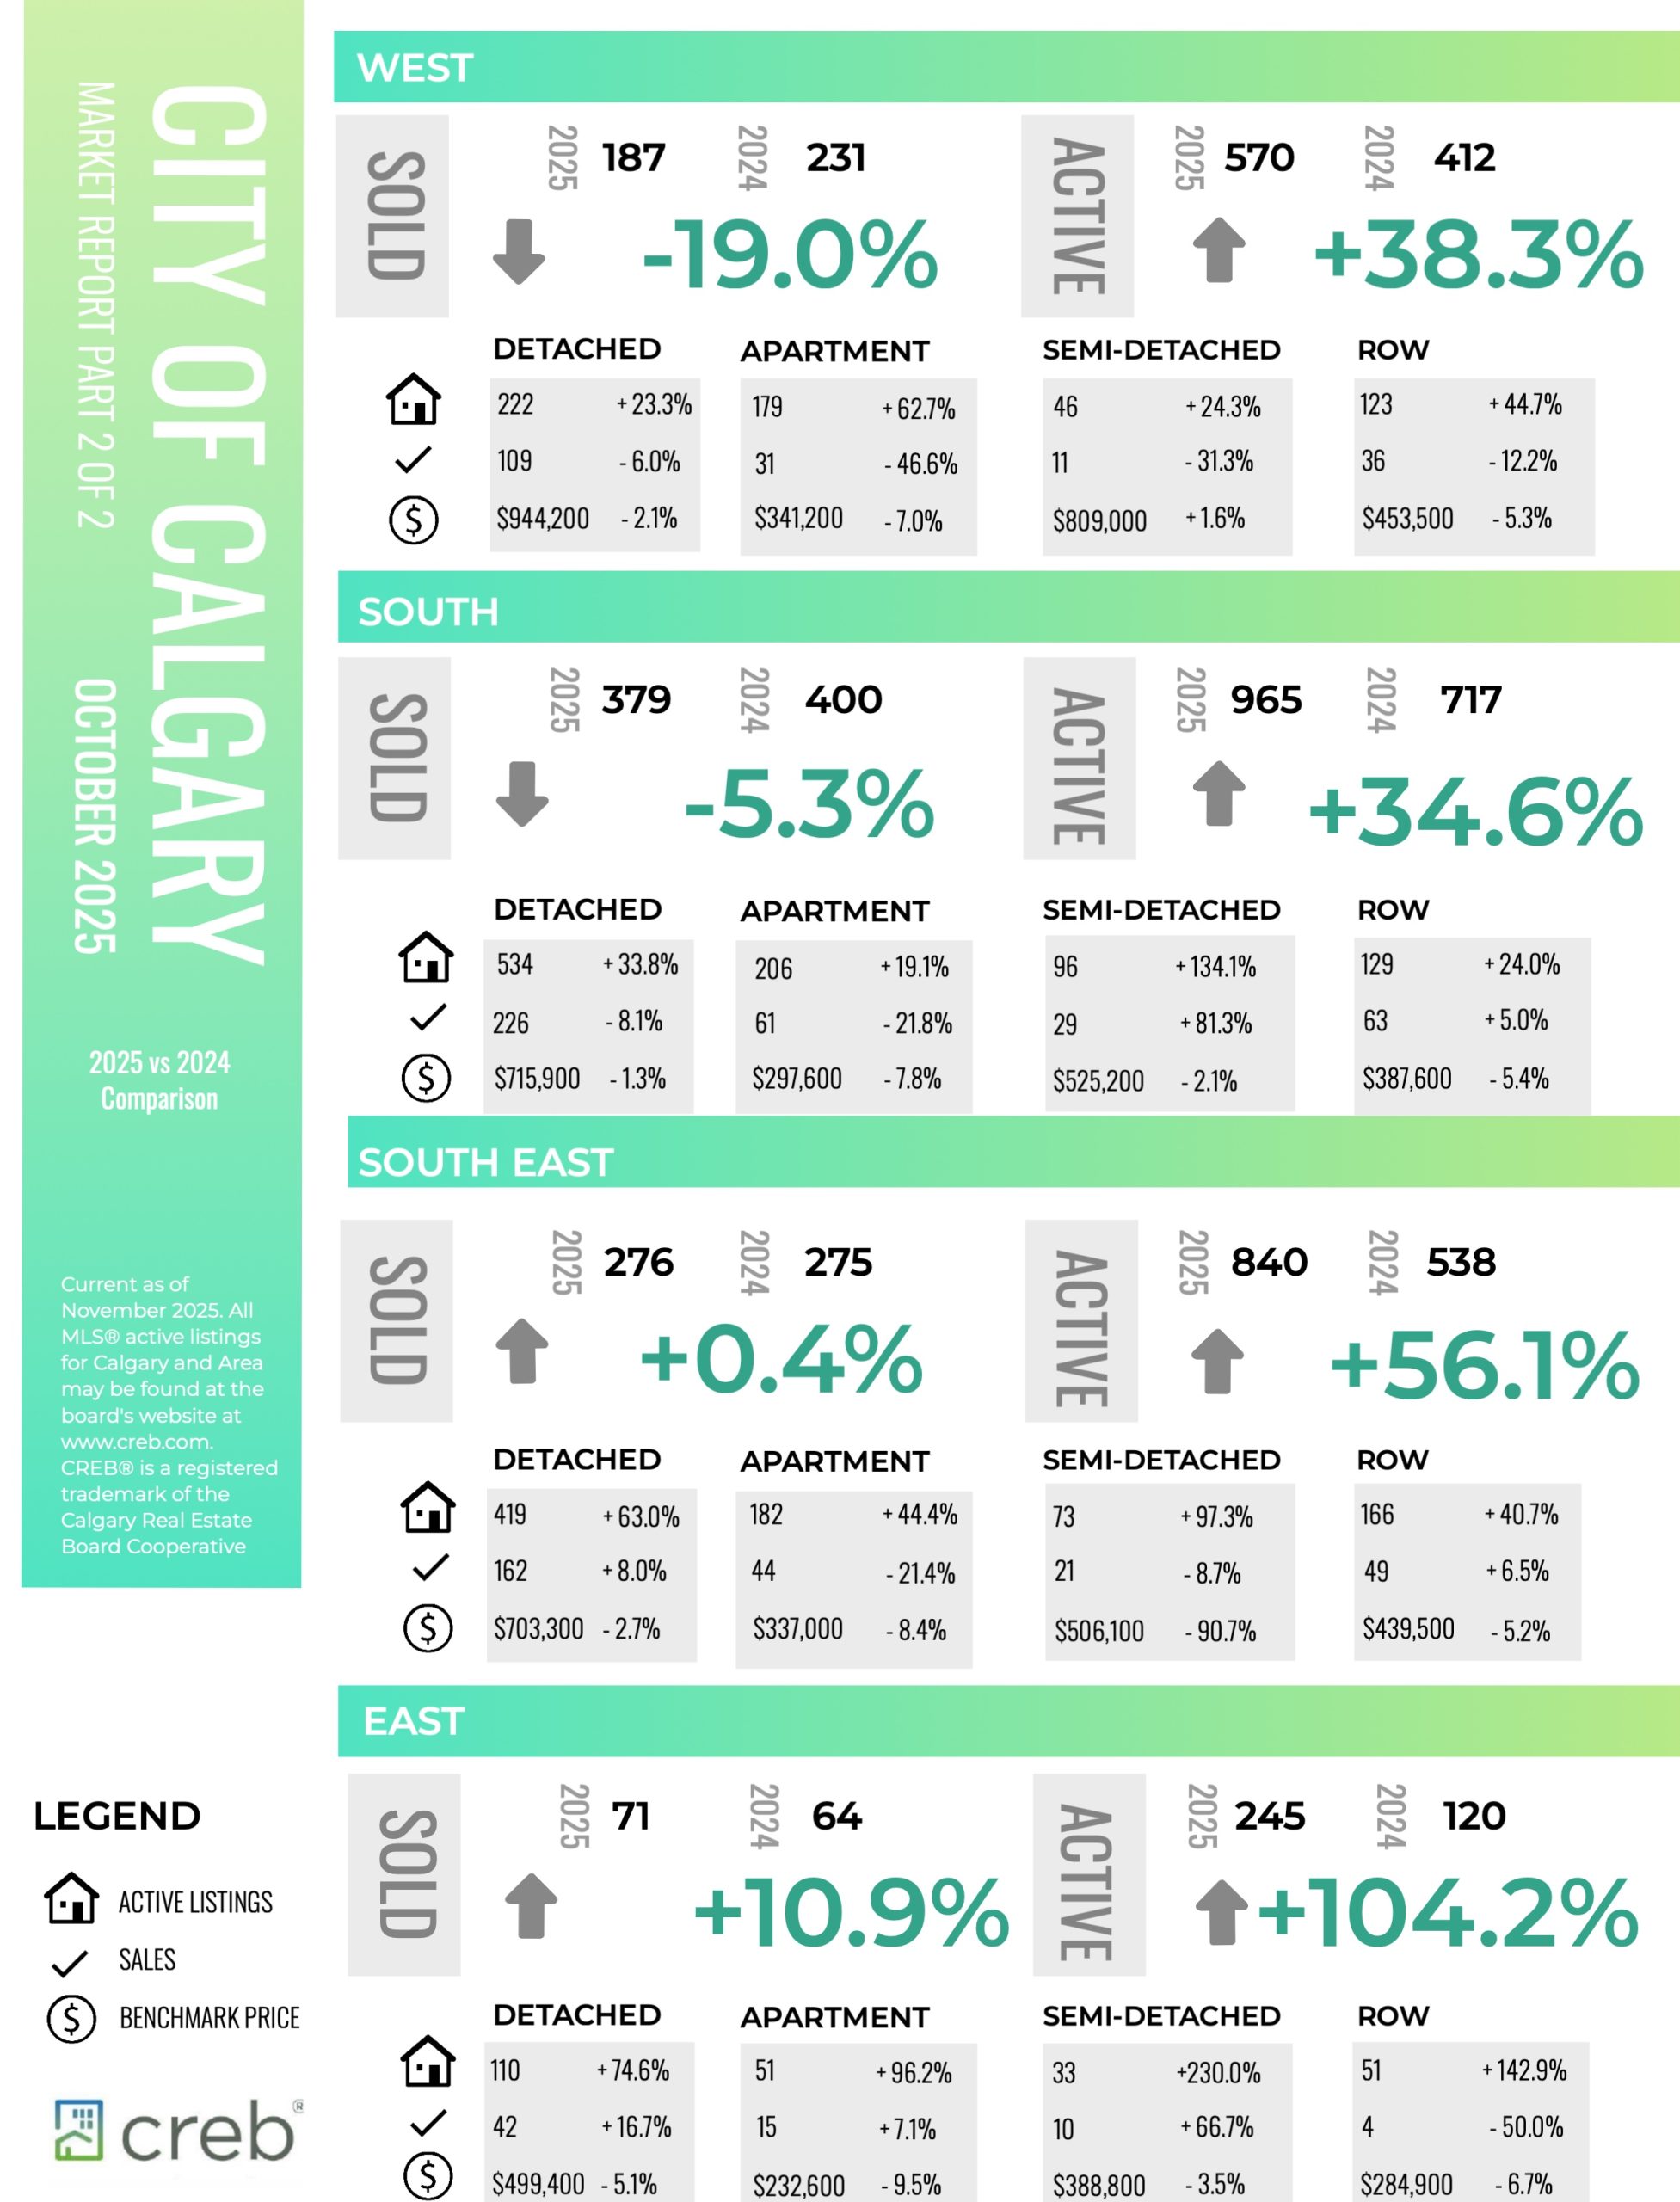
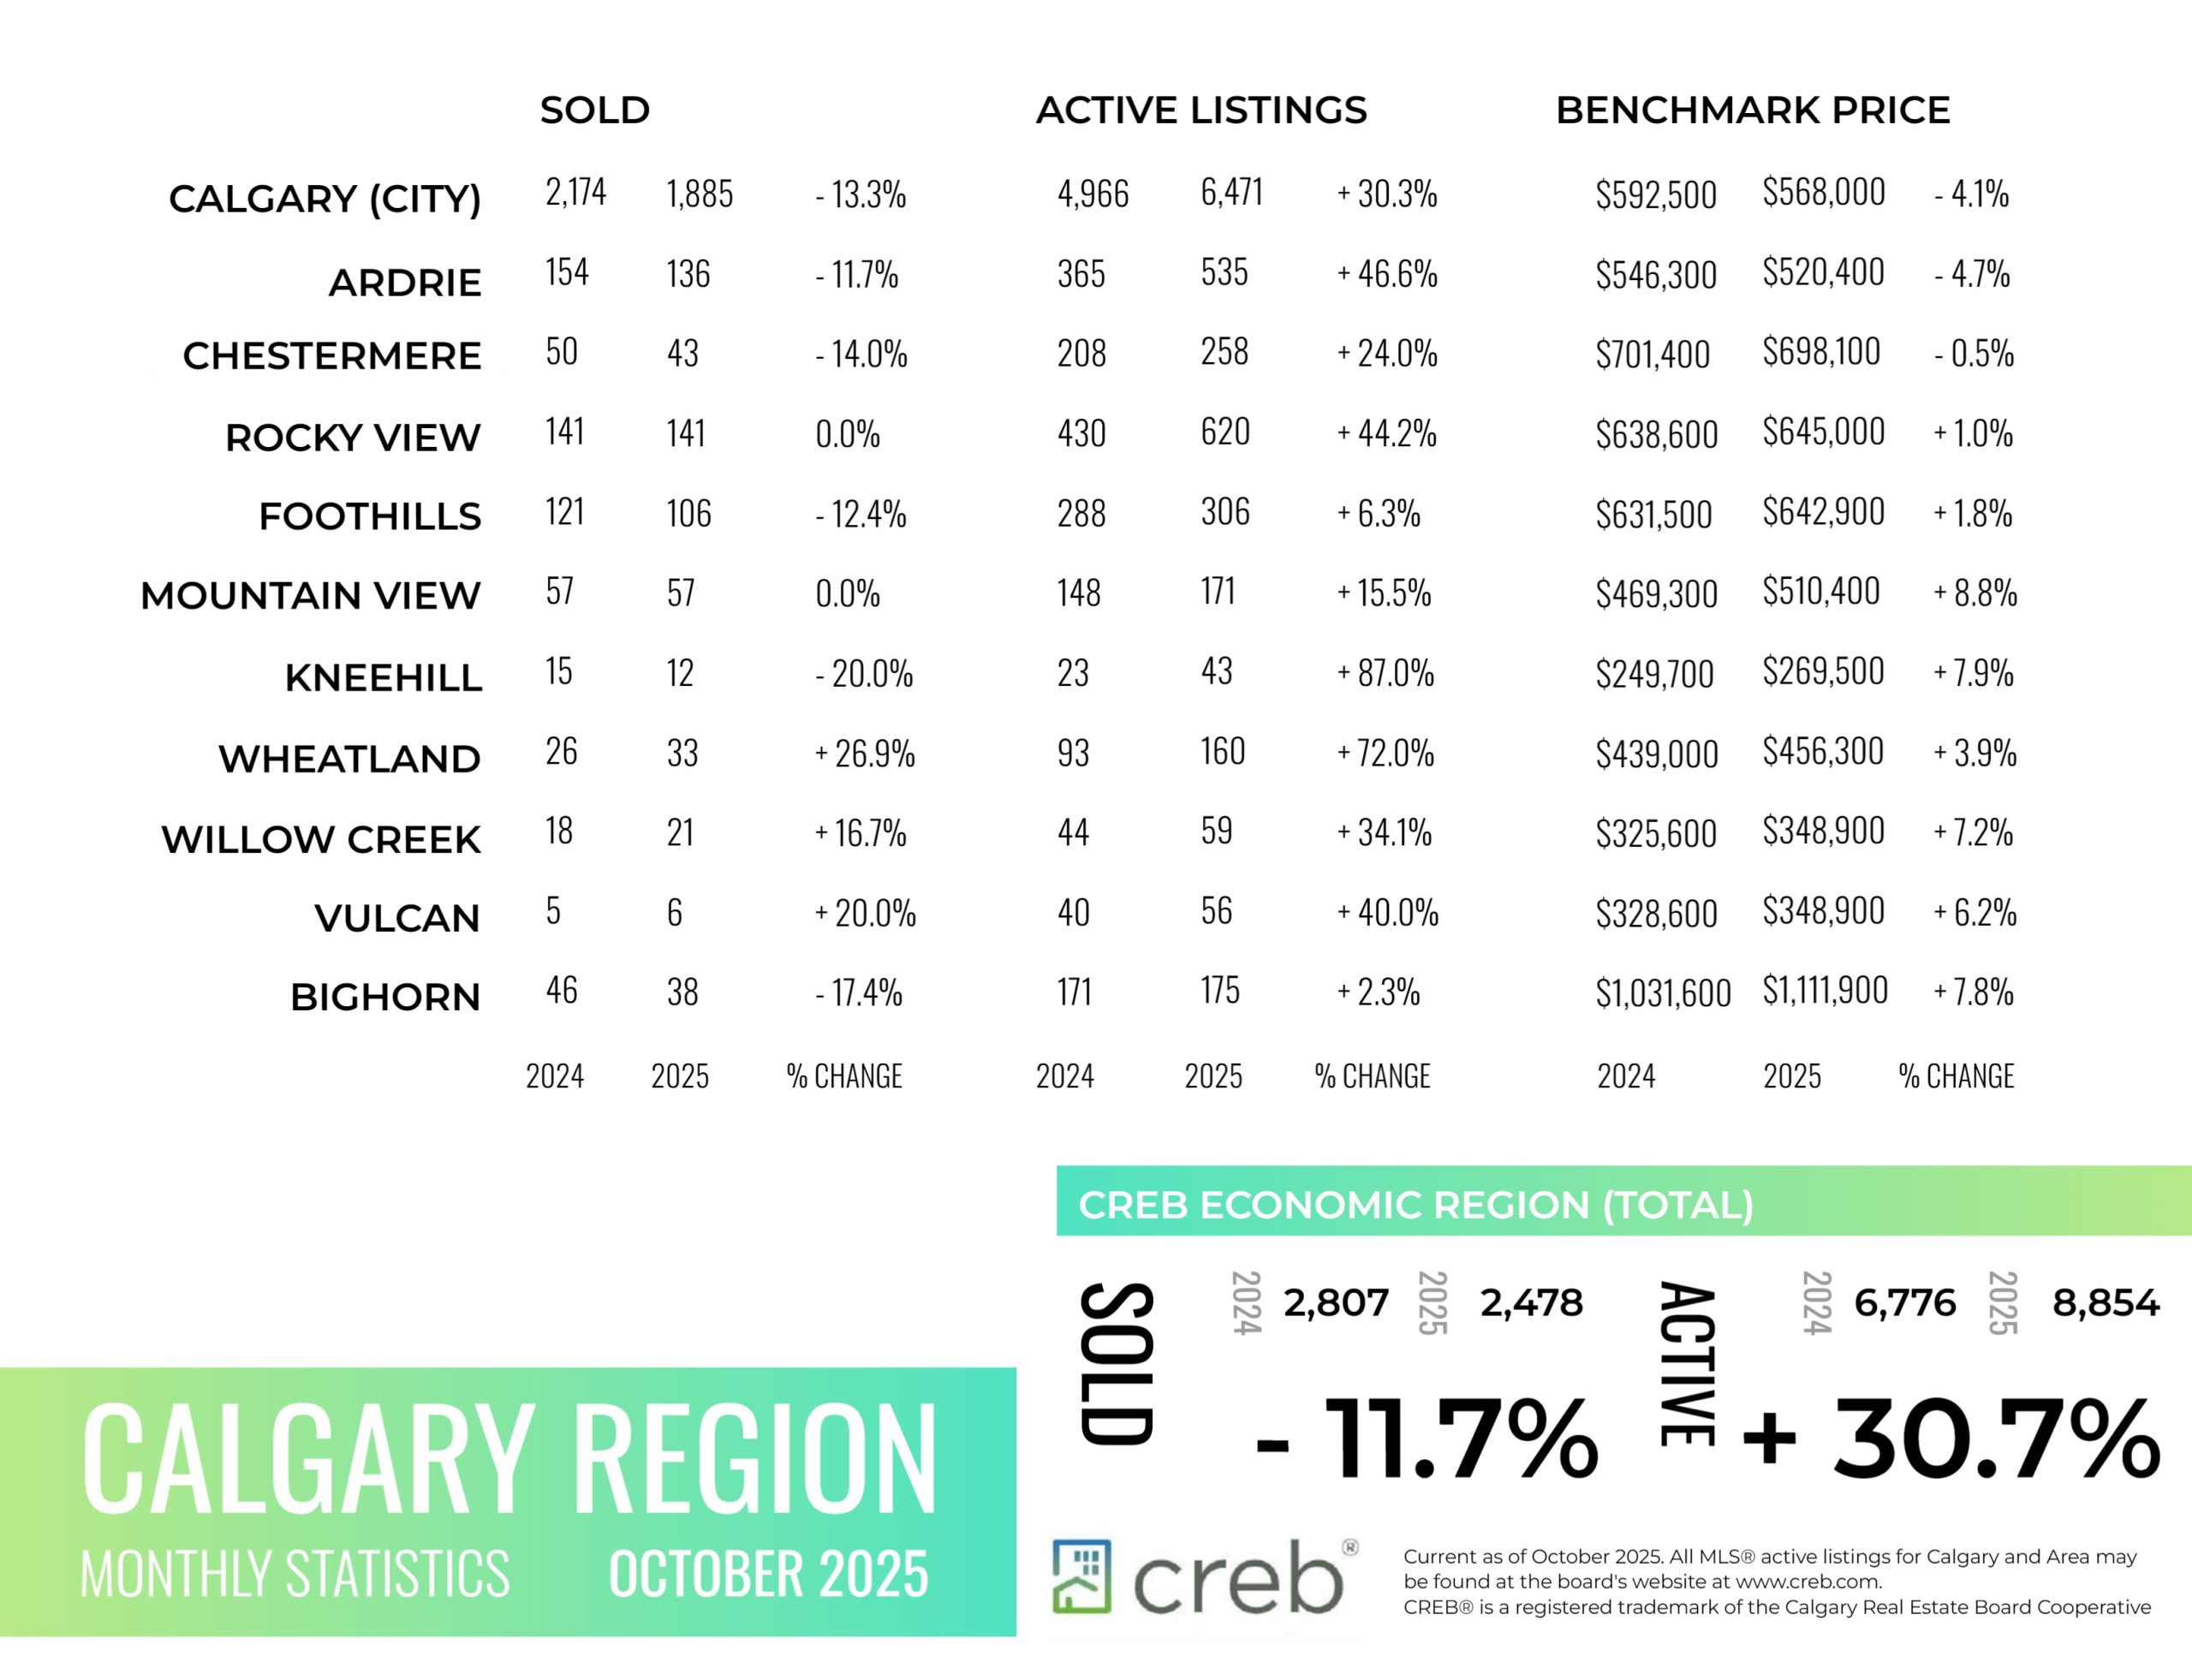
INFOGRAPHICS: October 2025 CREB City And Region Market Reports

Pace of new listings growth slows, preventing further inventory gains
Inventory levels eased over last month thanks to the combined impact of a monthly pullback in new listings and a monthly pick up in sales.
With 6,471 units in inventory and 1,885 sales the October months of supply returned to three-and-a-half months after pushing up to four months in September. While both row- and apartment-style properties continue to report elevated supply levels compared to demand, conditions remain relatively balanced for both detached and semi-detached properties.
Year-to-date sales in the city totaled 20,082, down nearly 16 per cent compared to last year, but still in line with longer-term trends. Much of the decline in sales has been driven by pullbacks for apartment- and row-style homes.
“Improved rental supply and easing rents have slowed ownership demand for apartment- and row-style homes. It is also these segments of the market that have seen October inventories reach a record high for the month,” said Ann-Marie Lurie, CREB®’s Chief Economist. “Excess supply for apartment- and row-style properties is weighing on prices in those segments more so than any other property type, influencing total residential prices.”
Read the full report on the CREB website!
The following data is a comparison between October 2025 and October 2024 numbers, and is current as of November of 2025. For last month’s numbers, check out our previous infographic.
Or follow this link for all our CREB Infographics!
Click on the images for a larger view!
Download Printable Version – October 2025 CREB, City of Calgary Report Pages 1 and 2
Download Printable Version – October 2025 CREB, Calgary Region Report
INFOGRAPHICS: September 2025 CREB City And Region Market Reports

A boost in new listings drives further inventory gains and price adjustments
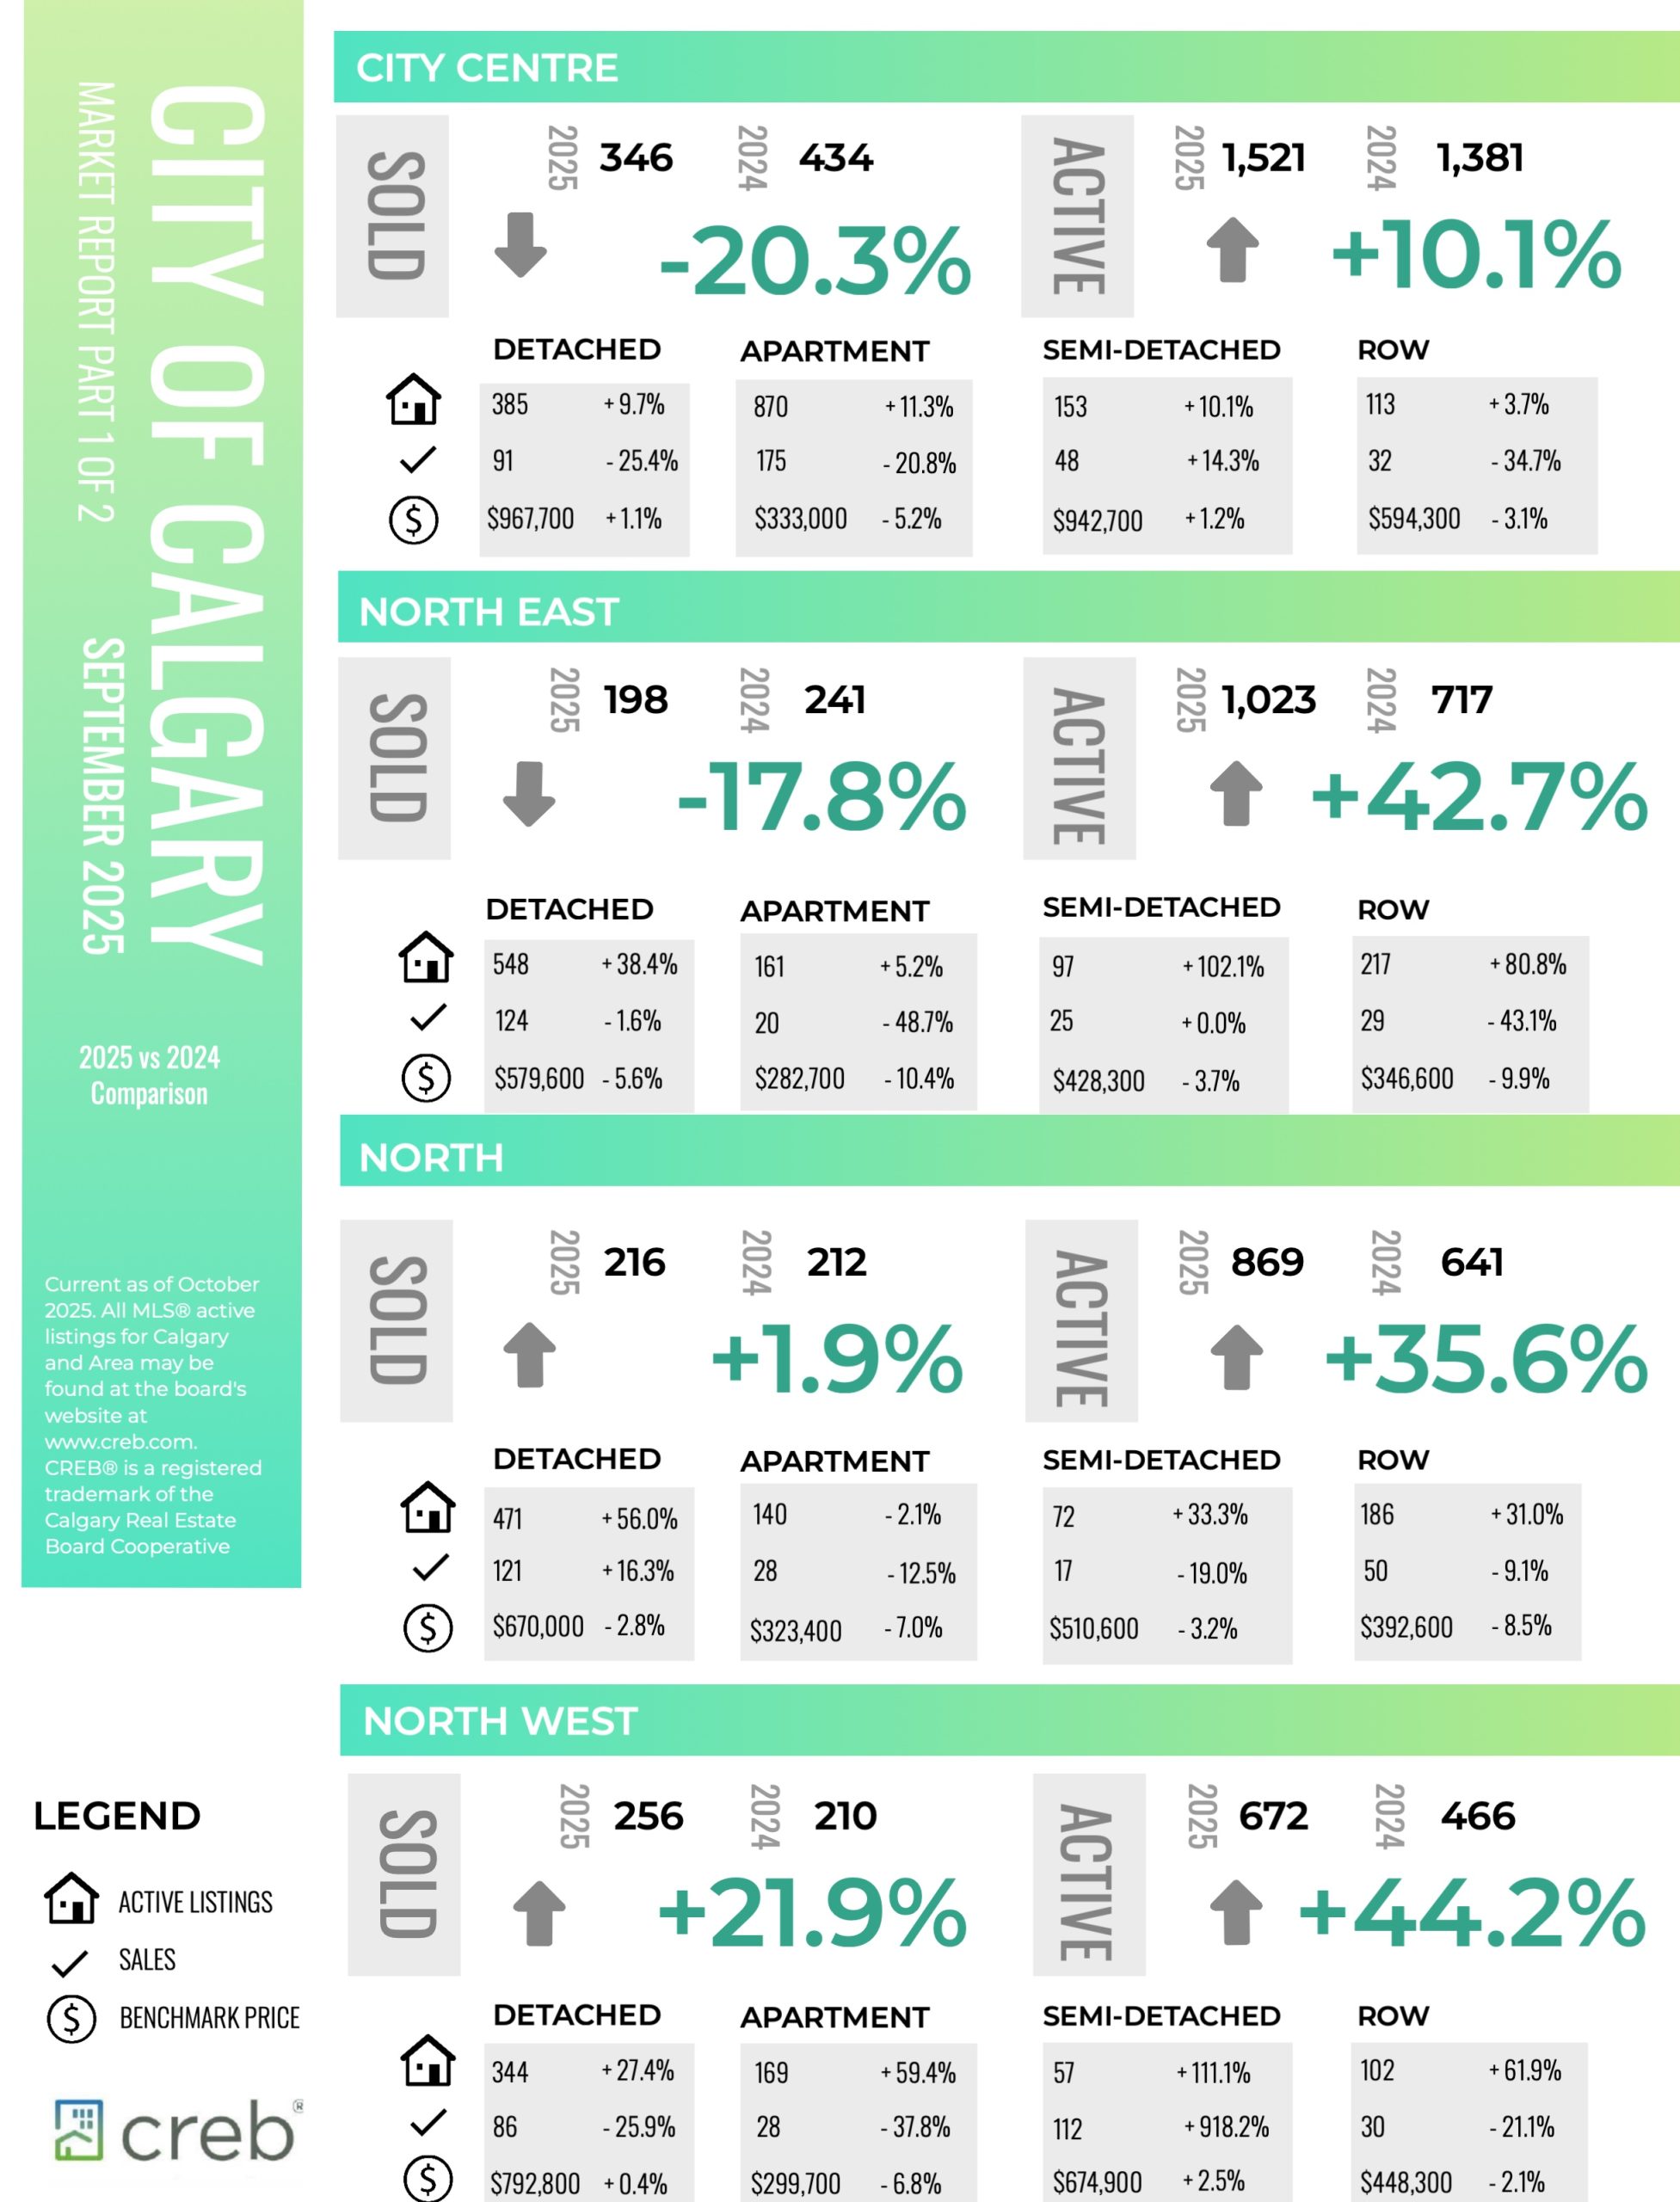
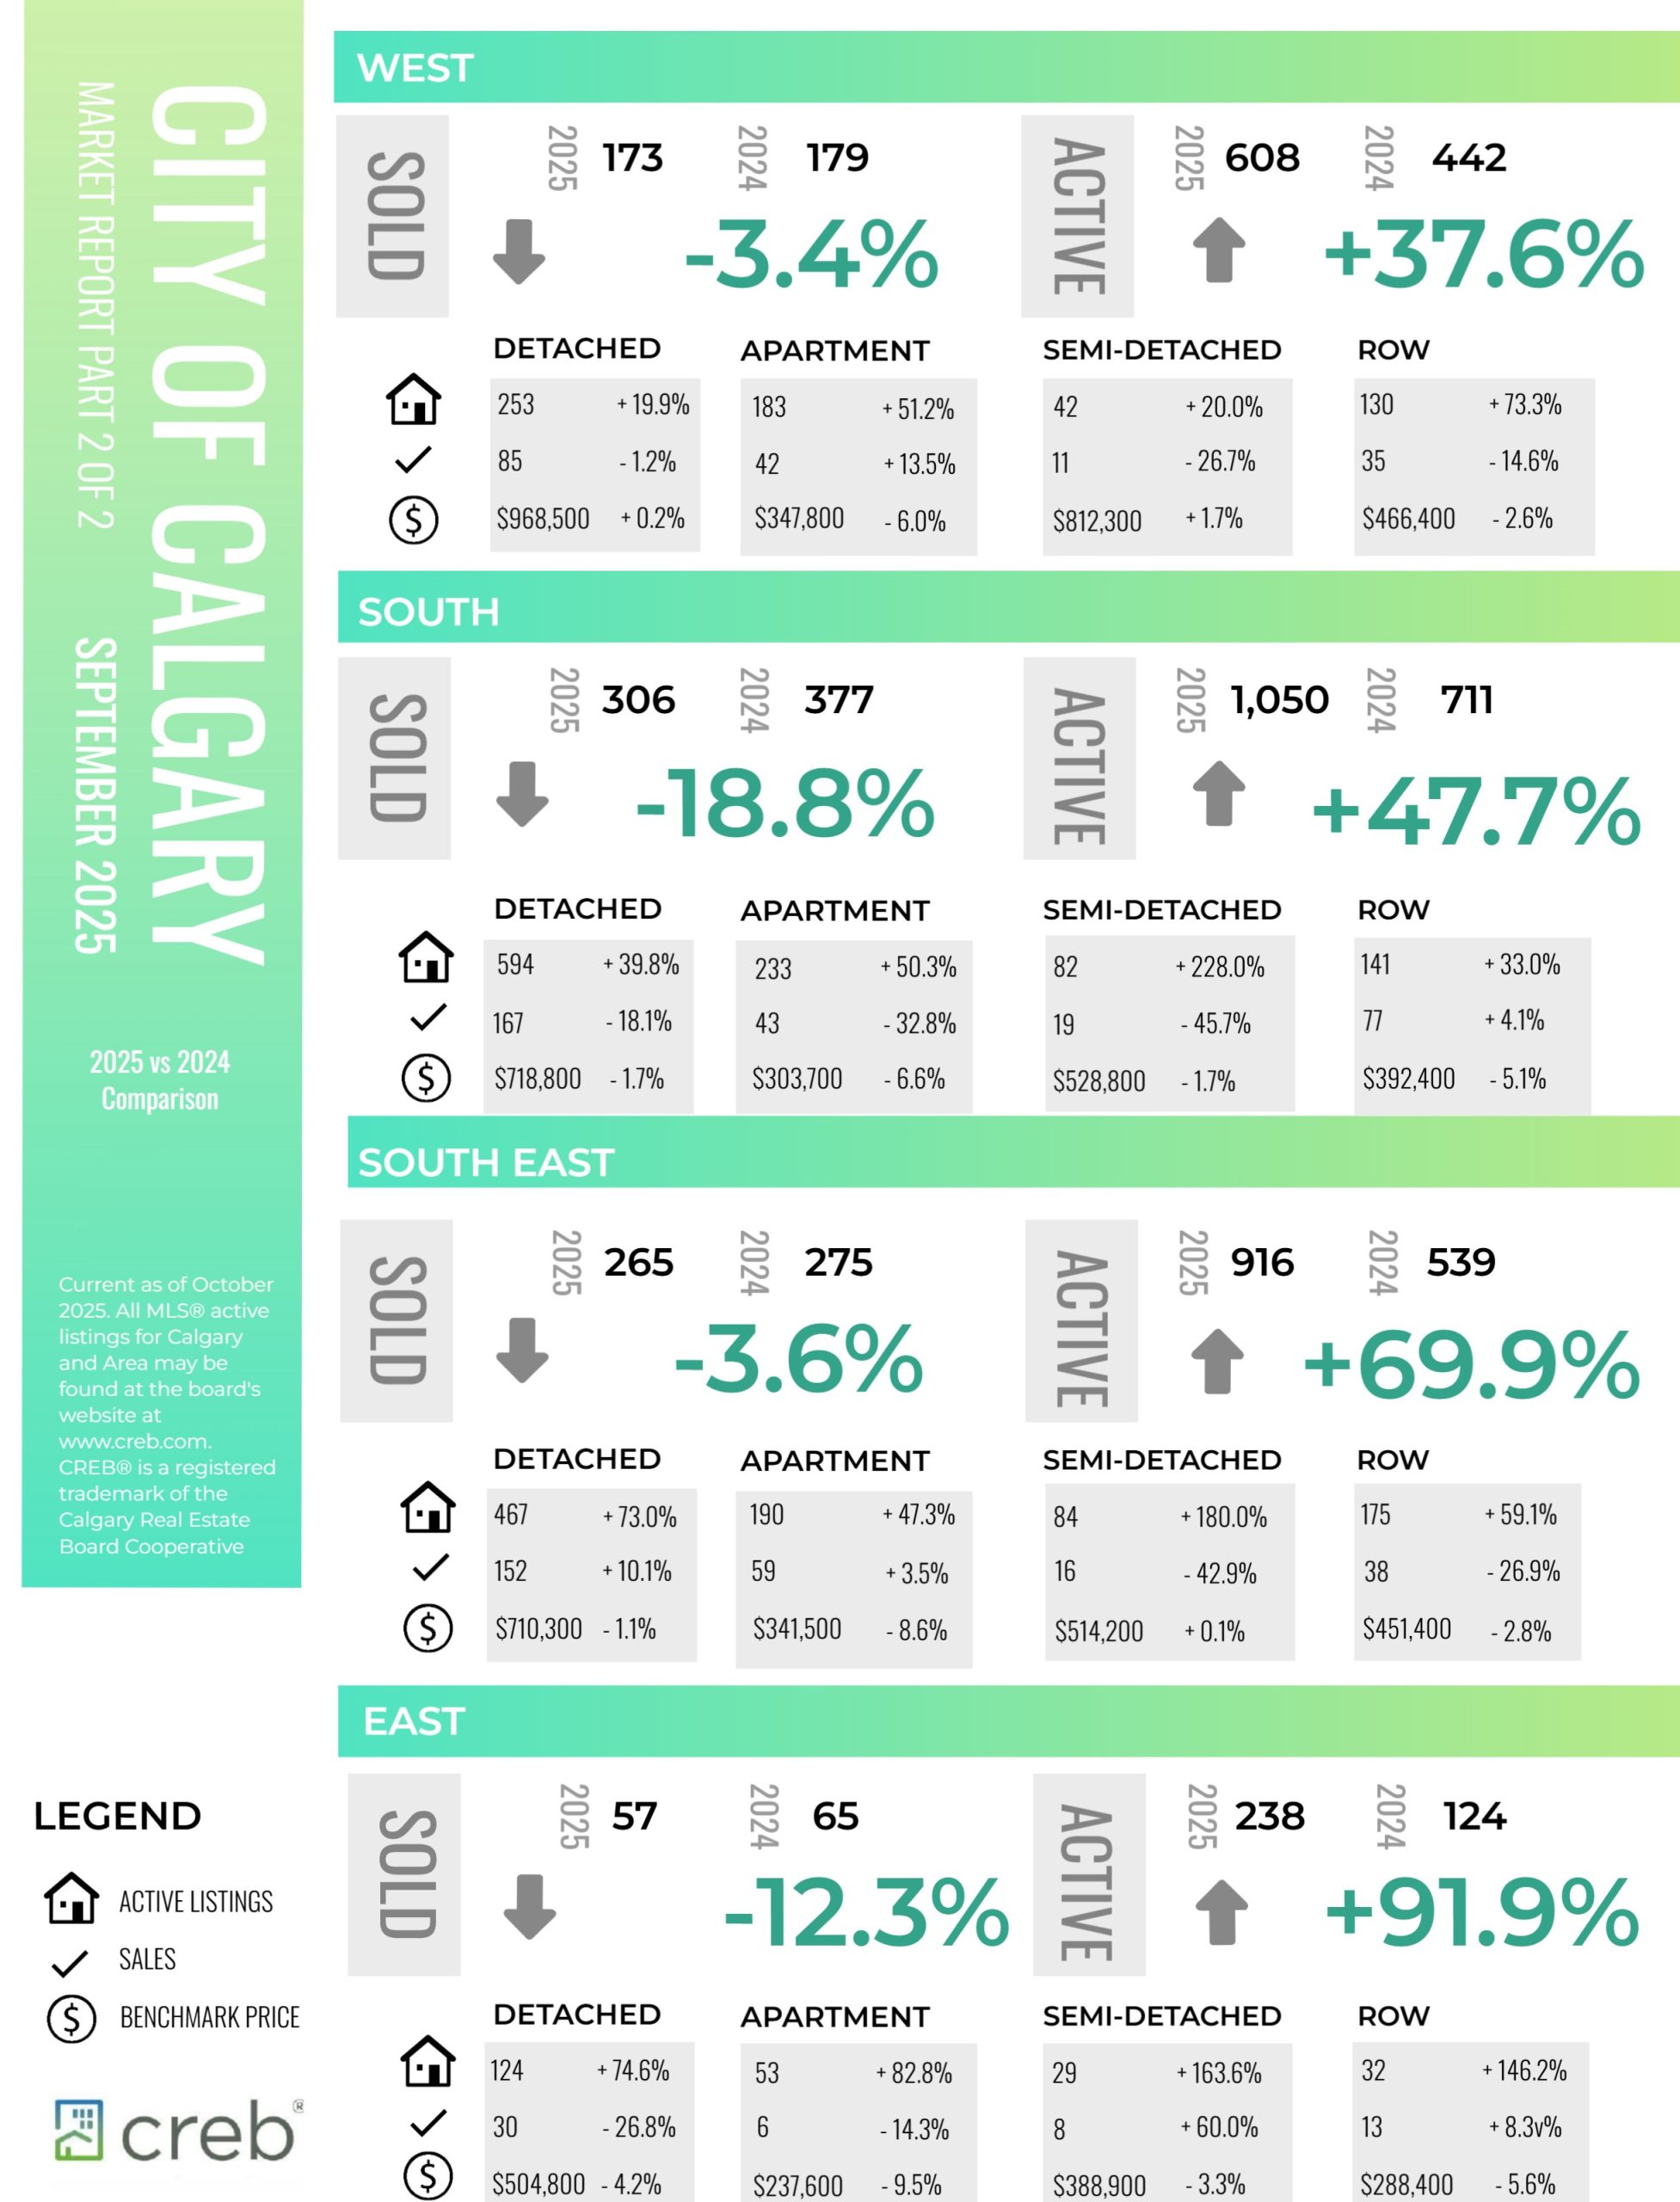
The 1,720 sales in September were not high enough to offset the 3,782 new listings coming onto the market, driving further inventory gains as we move into the fall. There were 6,916 units in inventory in September, 36 per cent higher than last year and over 17 per cent higher than levels traditionally reported in September. Both row and apartment style homes have reported the largest boost in supply compared to long-term trends.
“Supply levels have been rising in the resale, new home and rental markets. The additional supply choice is coming at a time when demand is slowing, mostly due to slower population growth and persistent uncertainty. Resale markets have more competition from new homes and additional supply in the rental market, reducing the sense of urgency amongst potential purchasers. Ultimately, the additional supply choice is weighing on home prices,” said Ann-Marie Lurie, CREB® Chief Economist.
Supply levels relative to demand typically drive shifts in home prices. In September, the sales to new listings ratio dipped to 45 per cent, and the months of supply pushed up to four months for the first time since early 2020. This is a higher level of supply compared to demand than is typically seen in the Calgary market and, should this persist, we could see a market that shifts more in favour of the buyer. However, conditions do vary by property type, price range and location.
Read the full report on the CREB website!
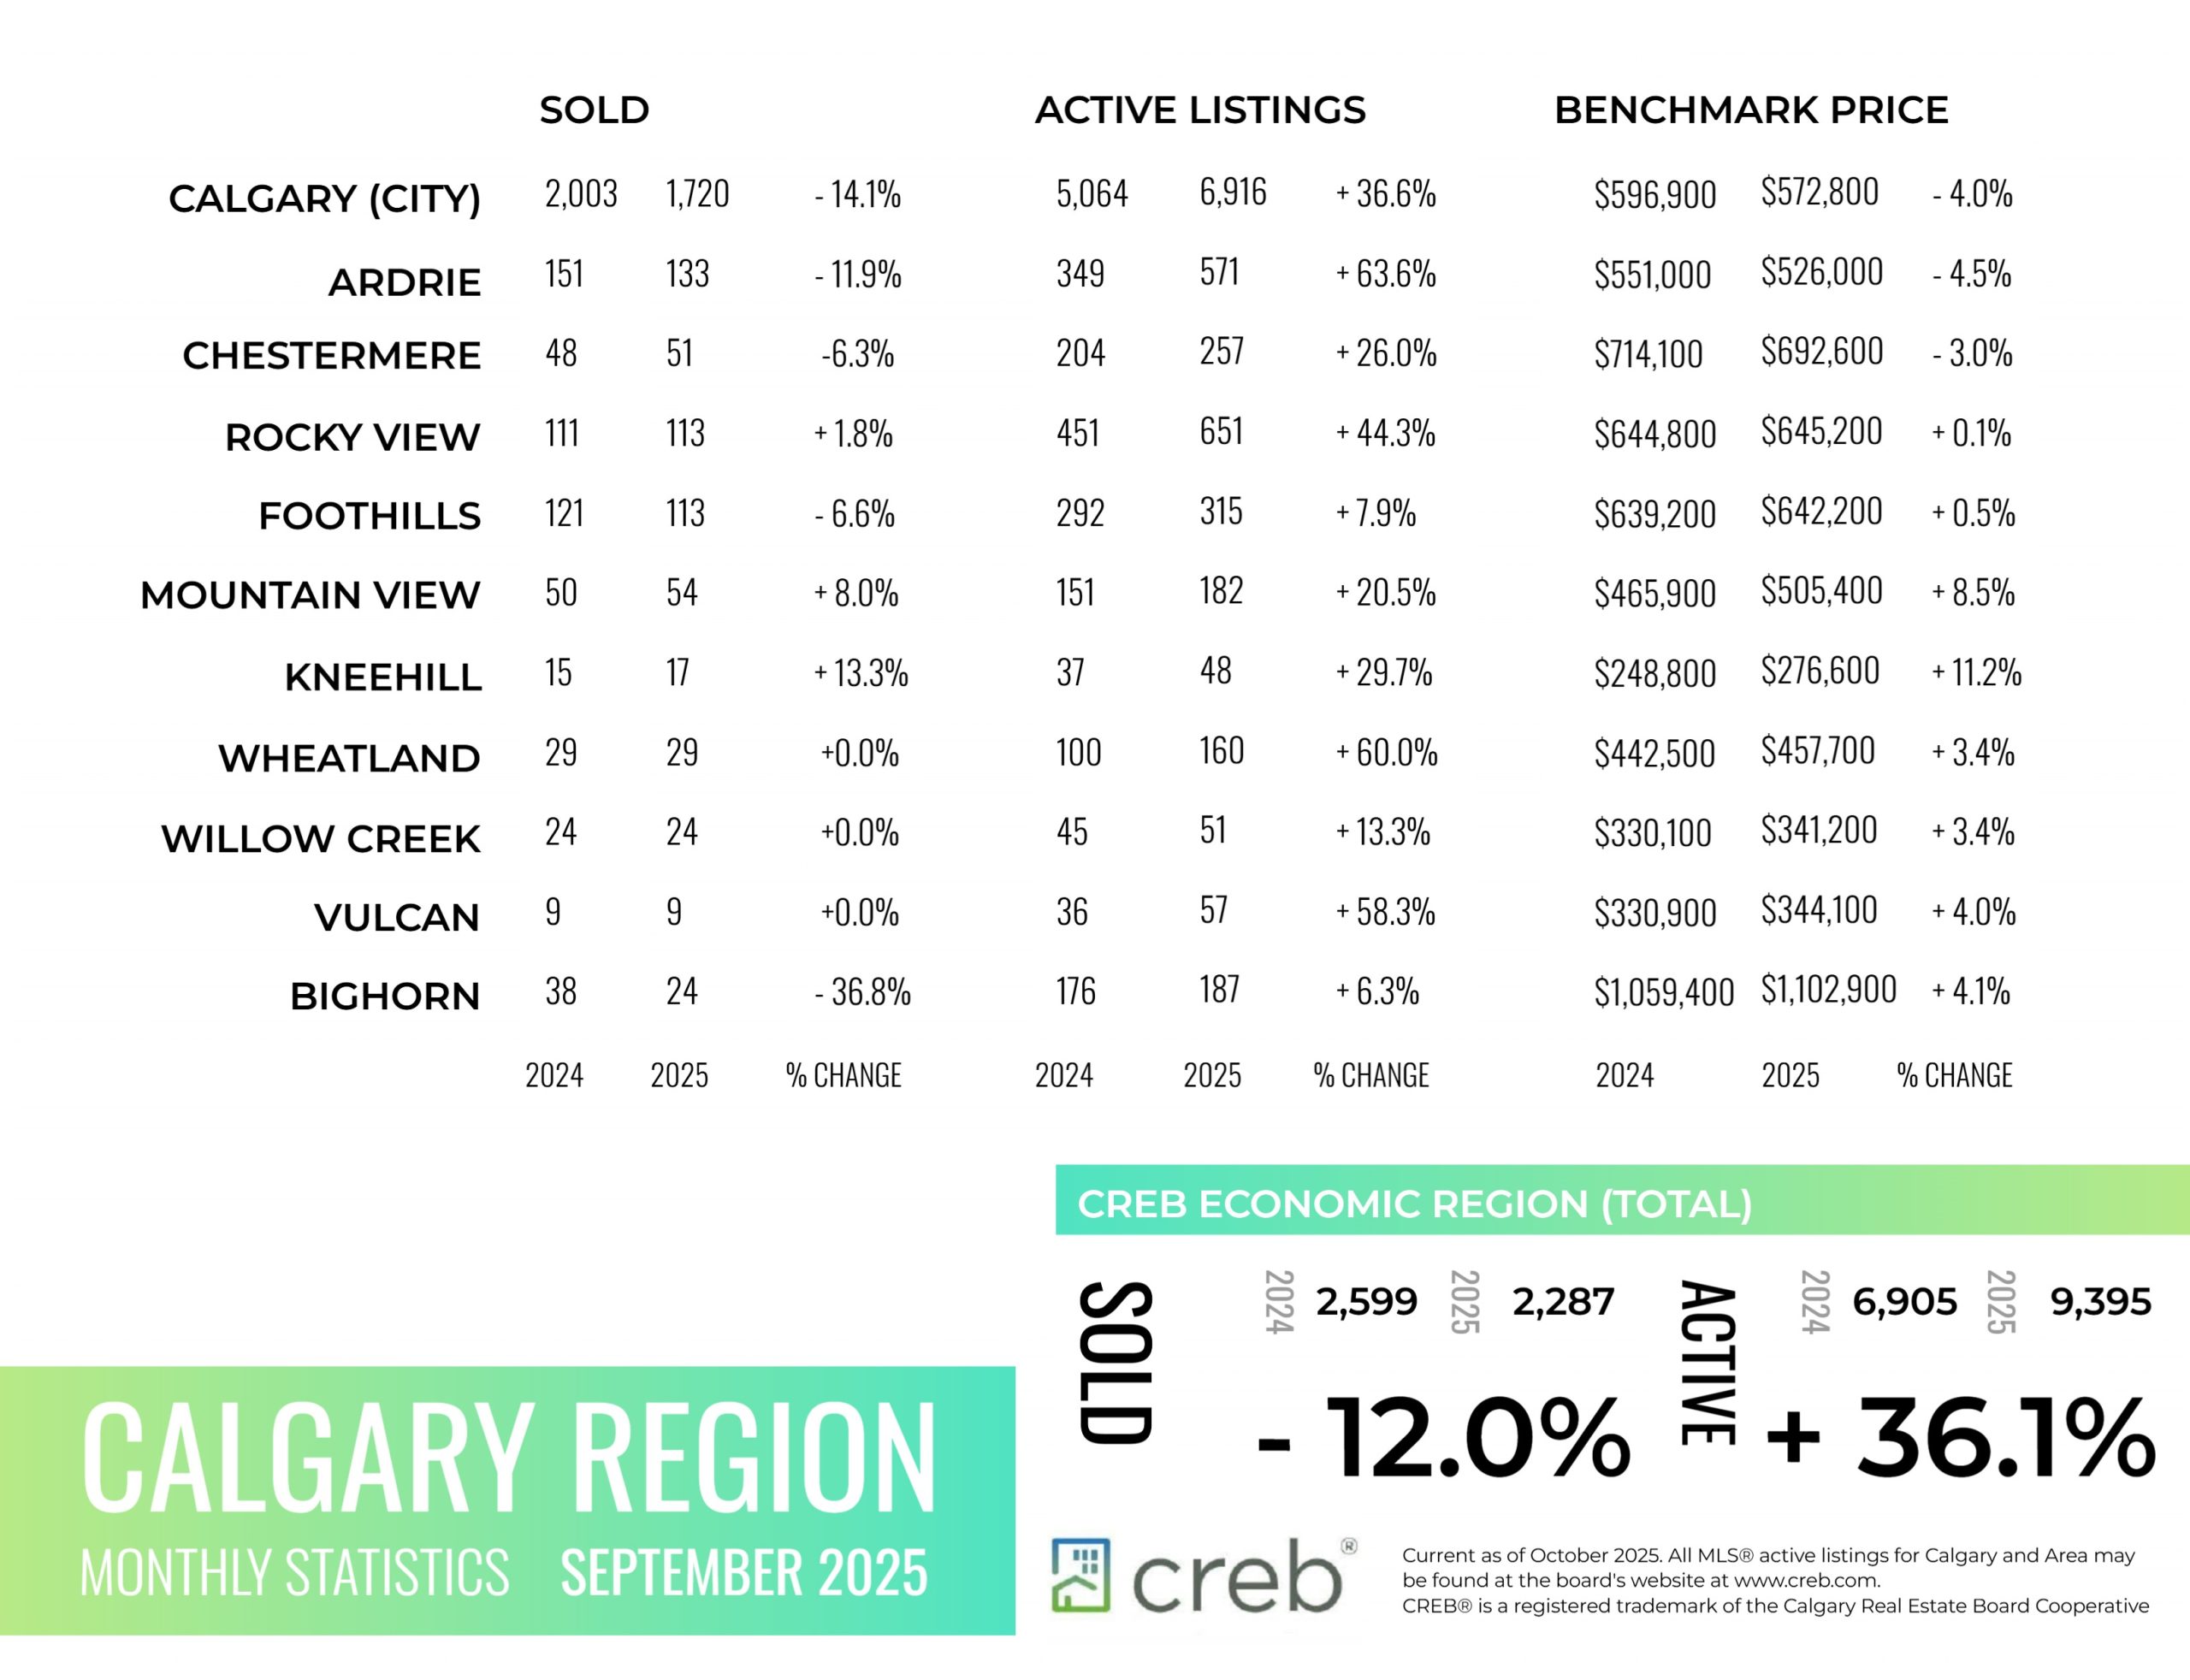
The following data is a comparison between September 2025 and September 2024 numbers, and is current as of October of 2025. For last month’s numbers, check out our previous infographic.
Or follow this link for all our CREB Infographics!
Click on the images for a larger view!
Download Printable Version – September 2025 CREB, City of Calgary Report Pages 1 and 2
Download Printable Version – September 2025 CREB, Calgary Region Report
INFOGRAPHICS: August 2025 CREB City And Region Market Reports

Price declines mostly driven by higher density home types
Improving supply choice has changed the dynamics of the Calgary market driving price declines over the past several months.
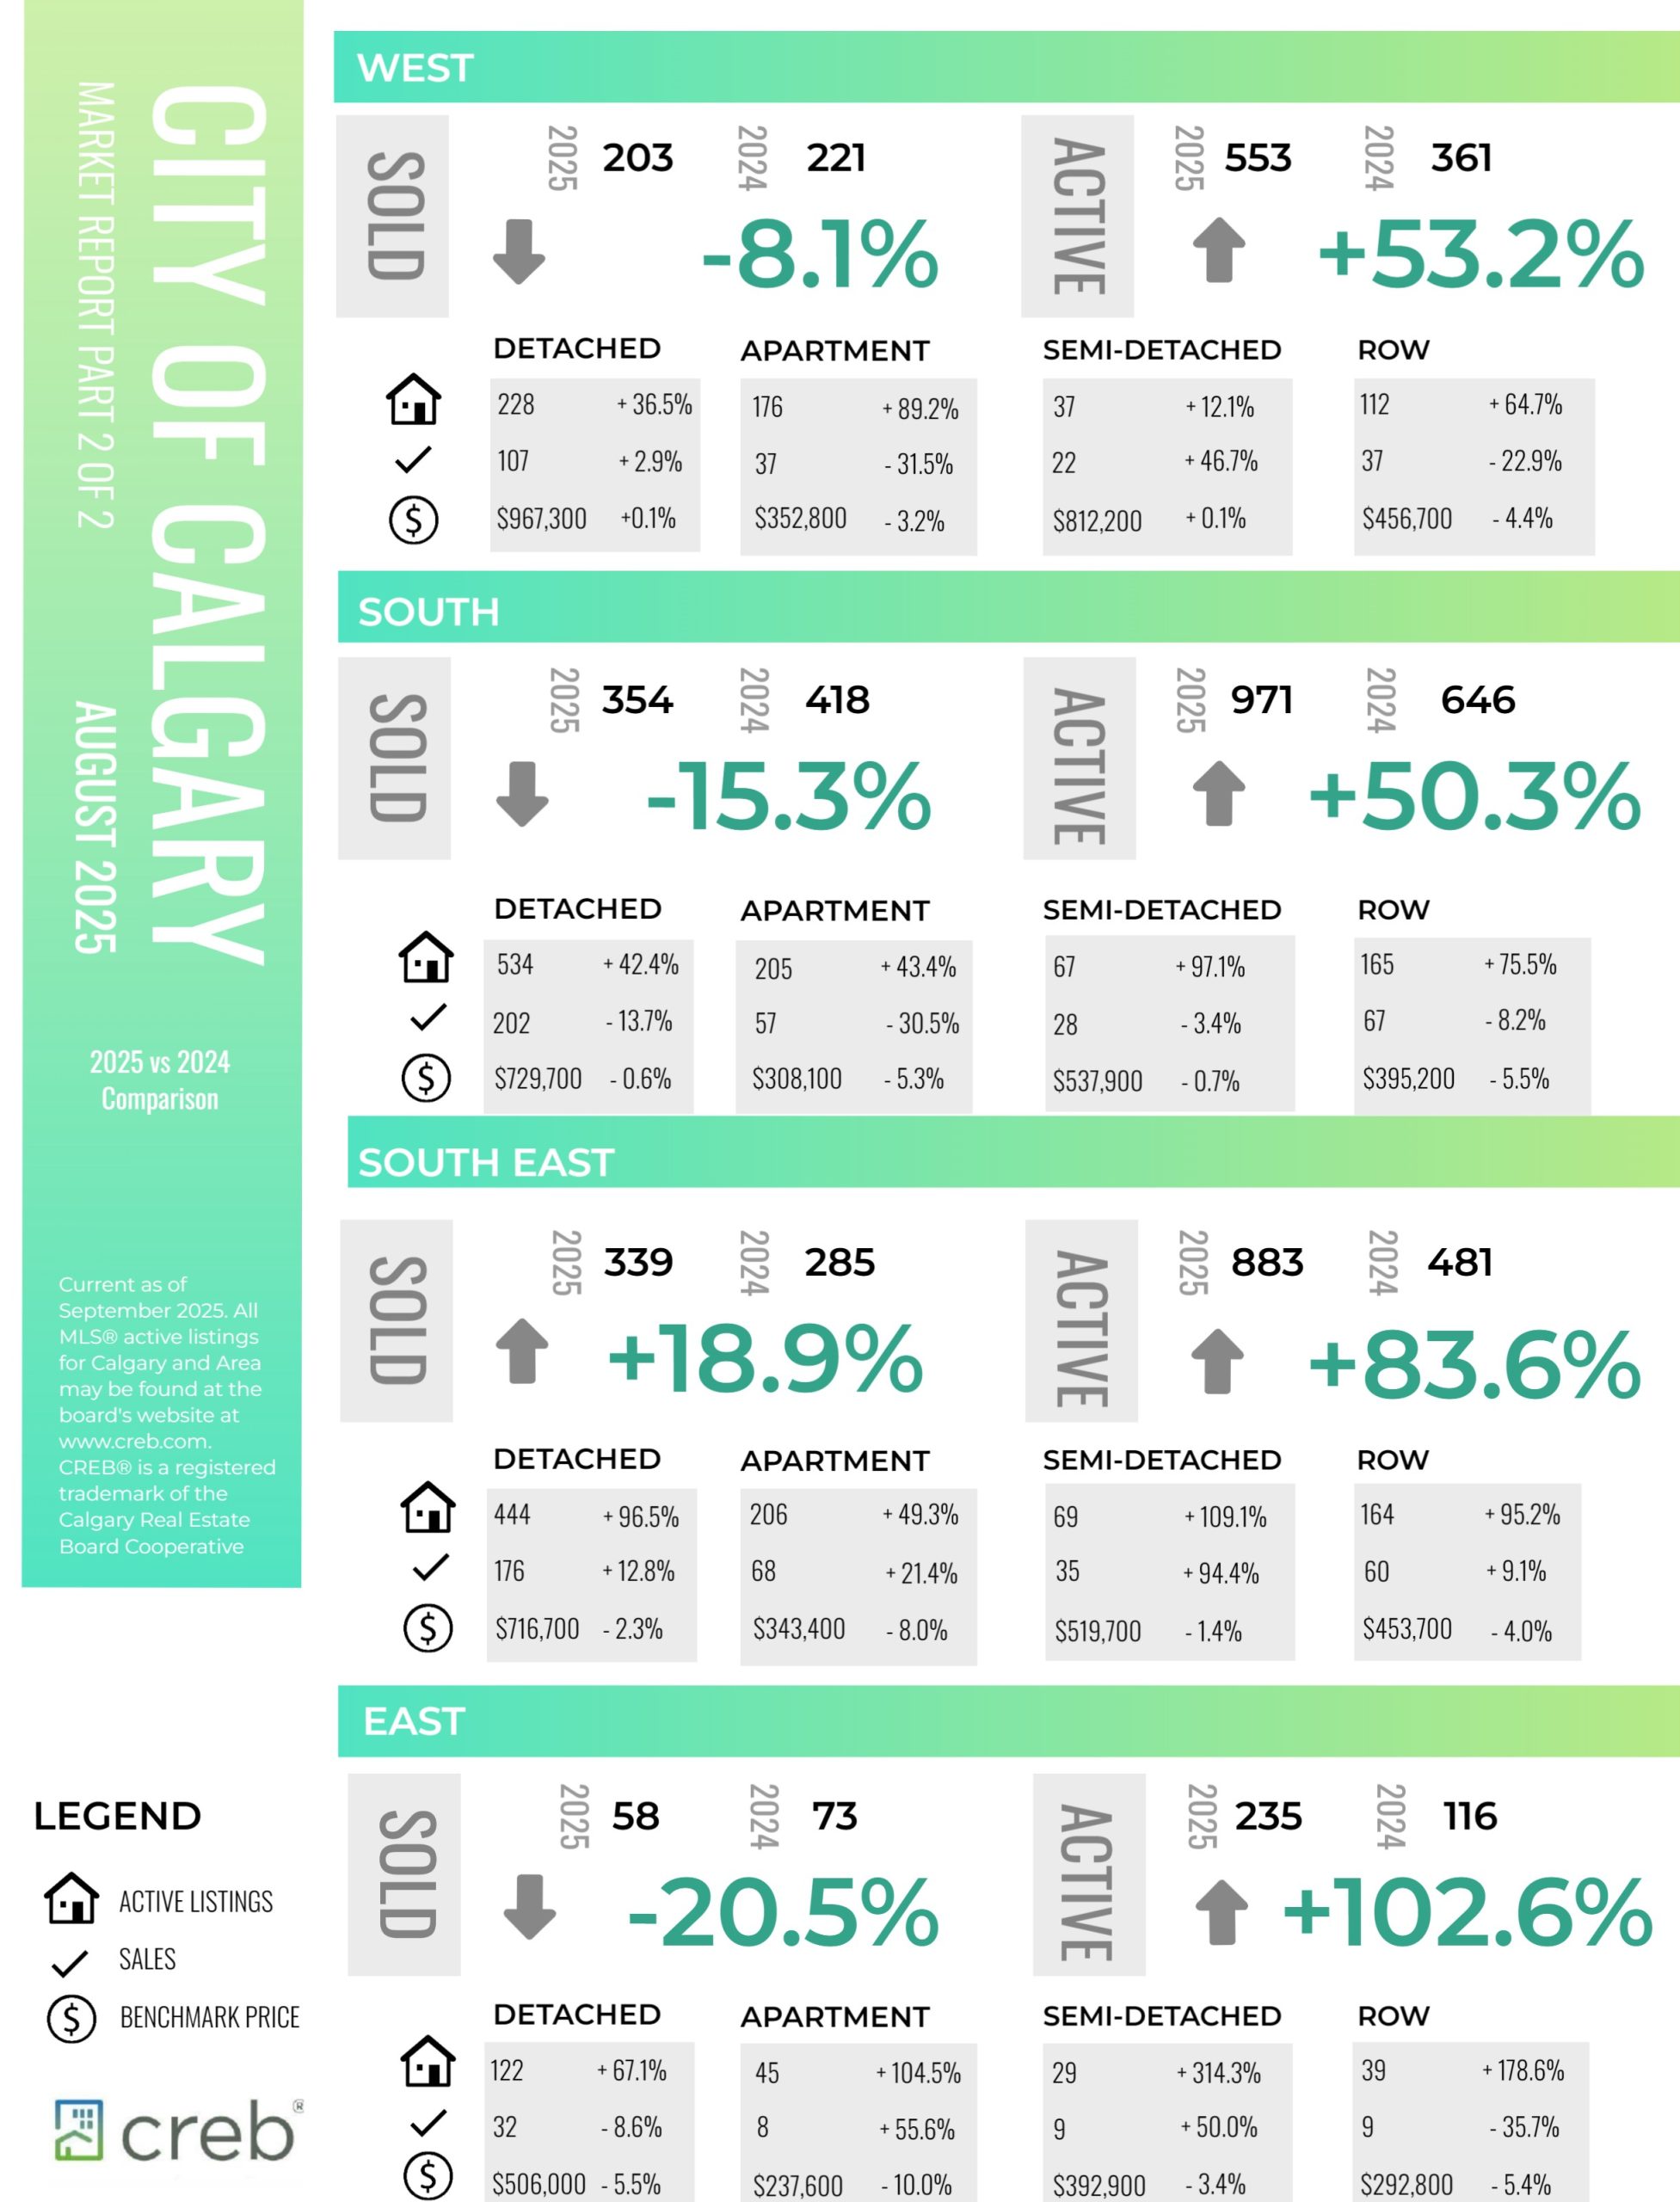
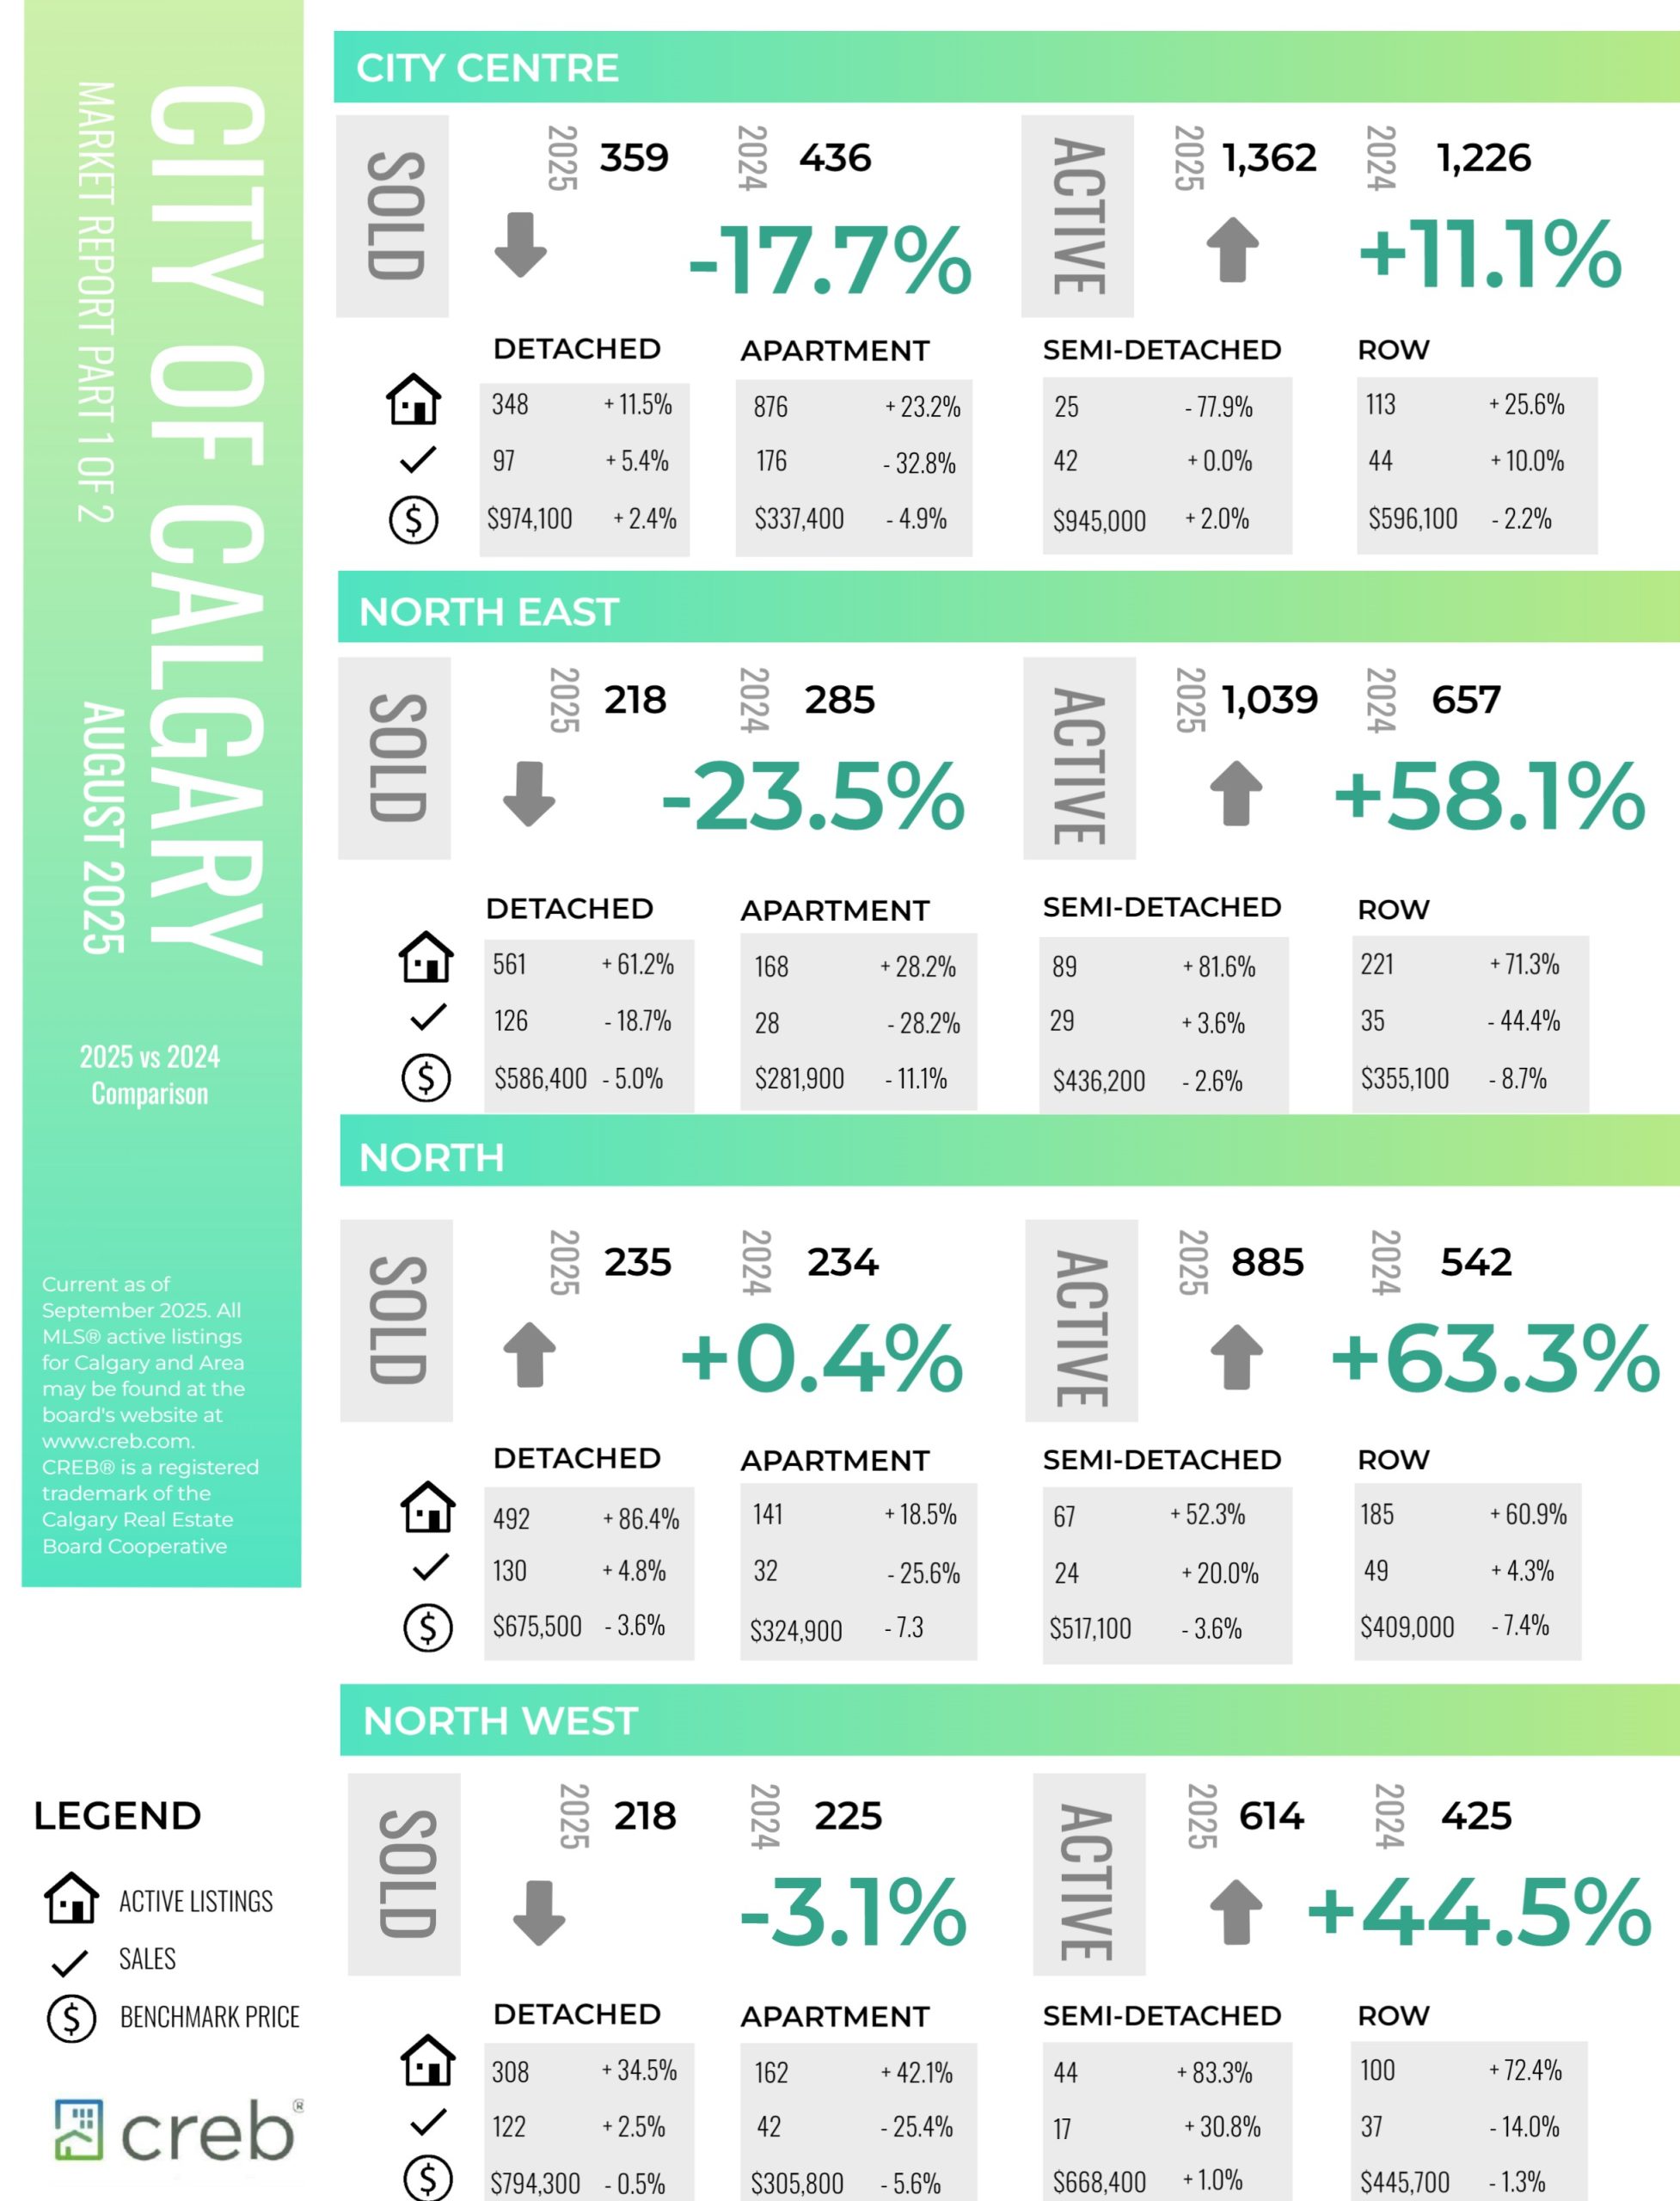
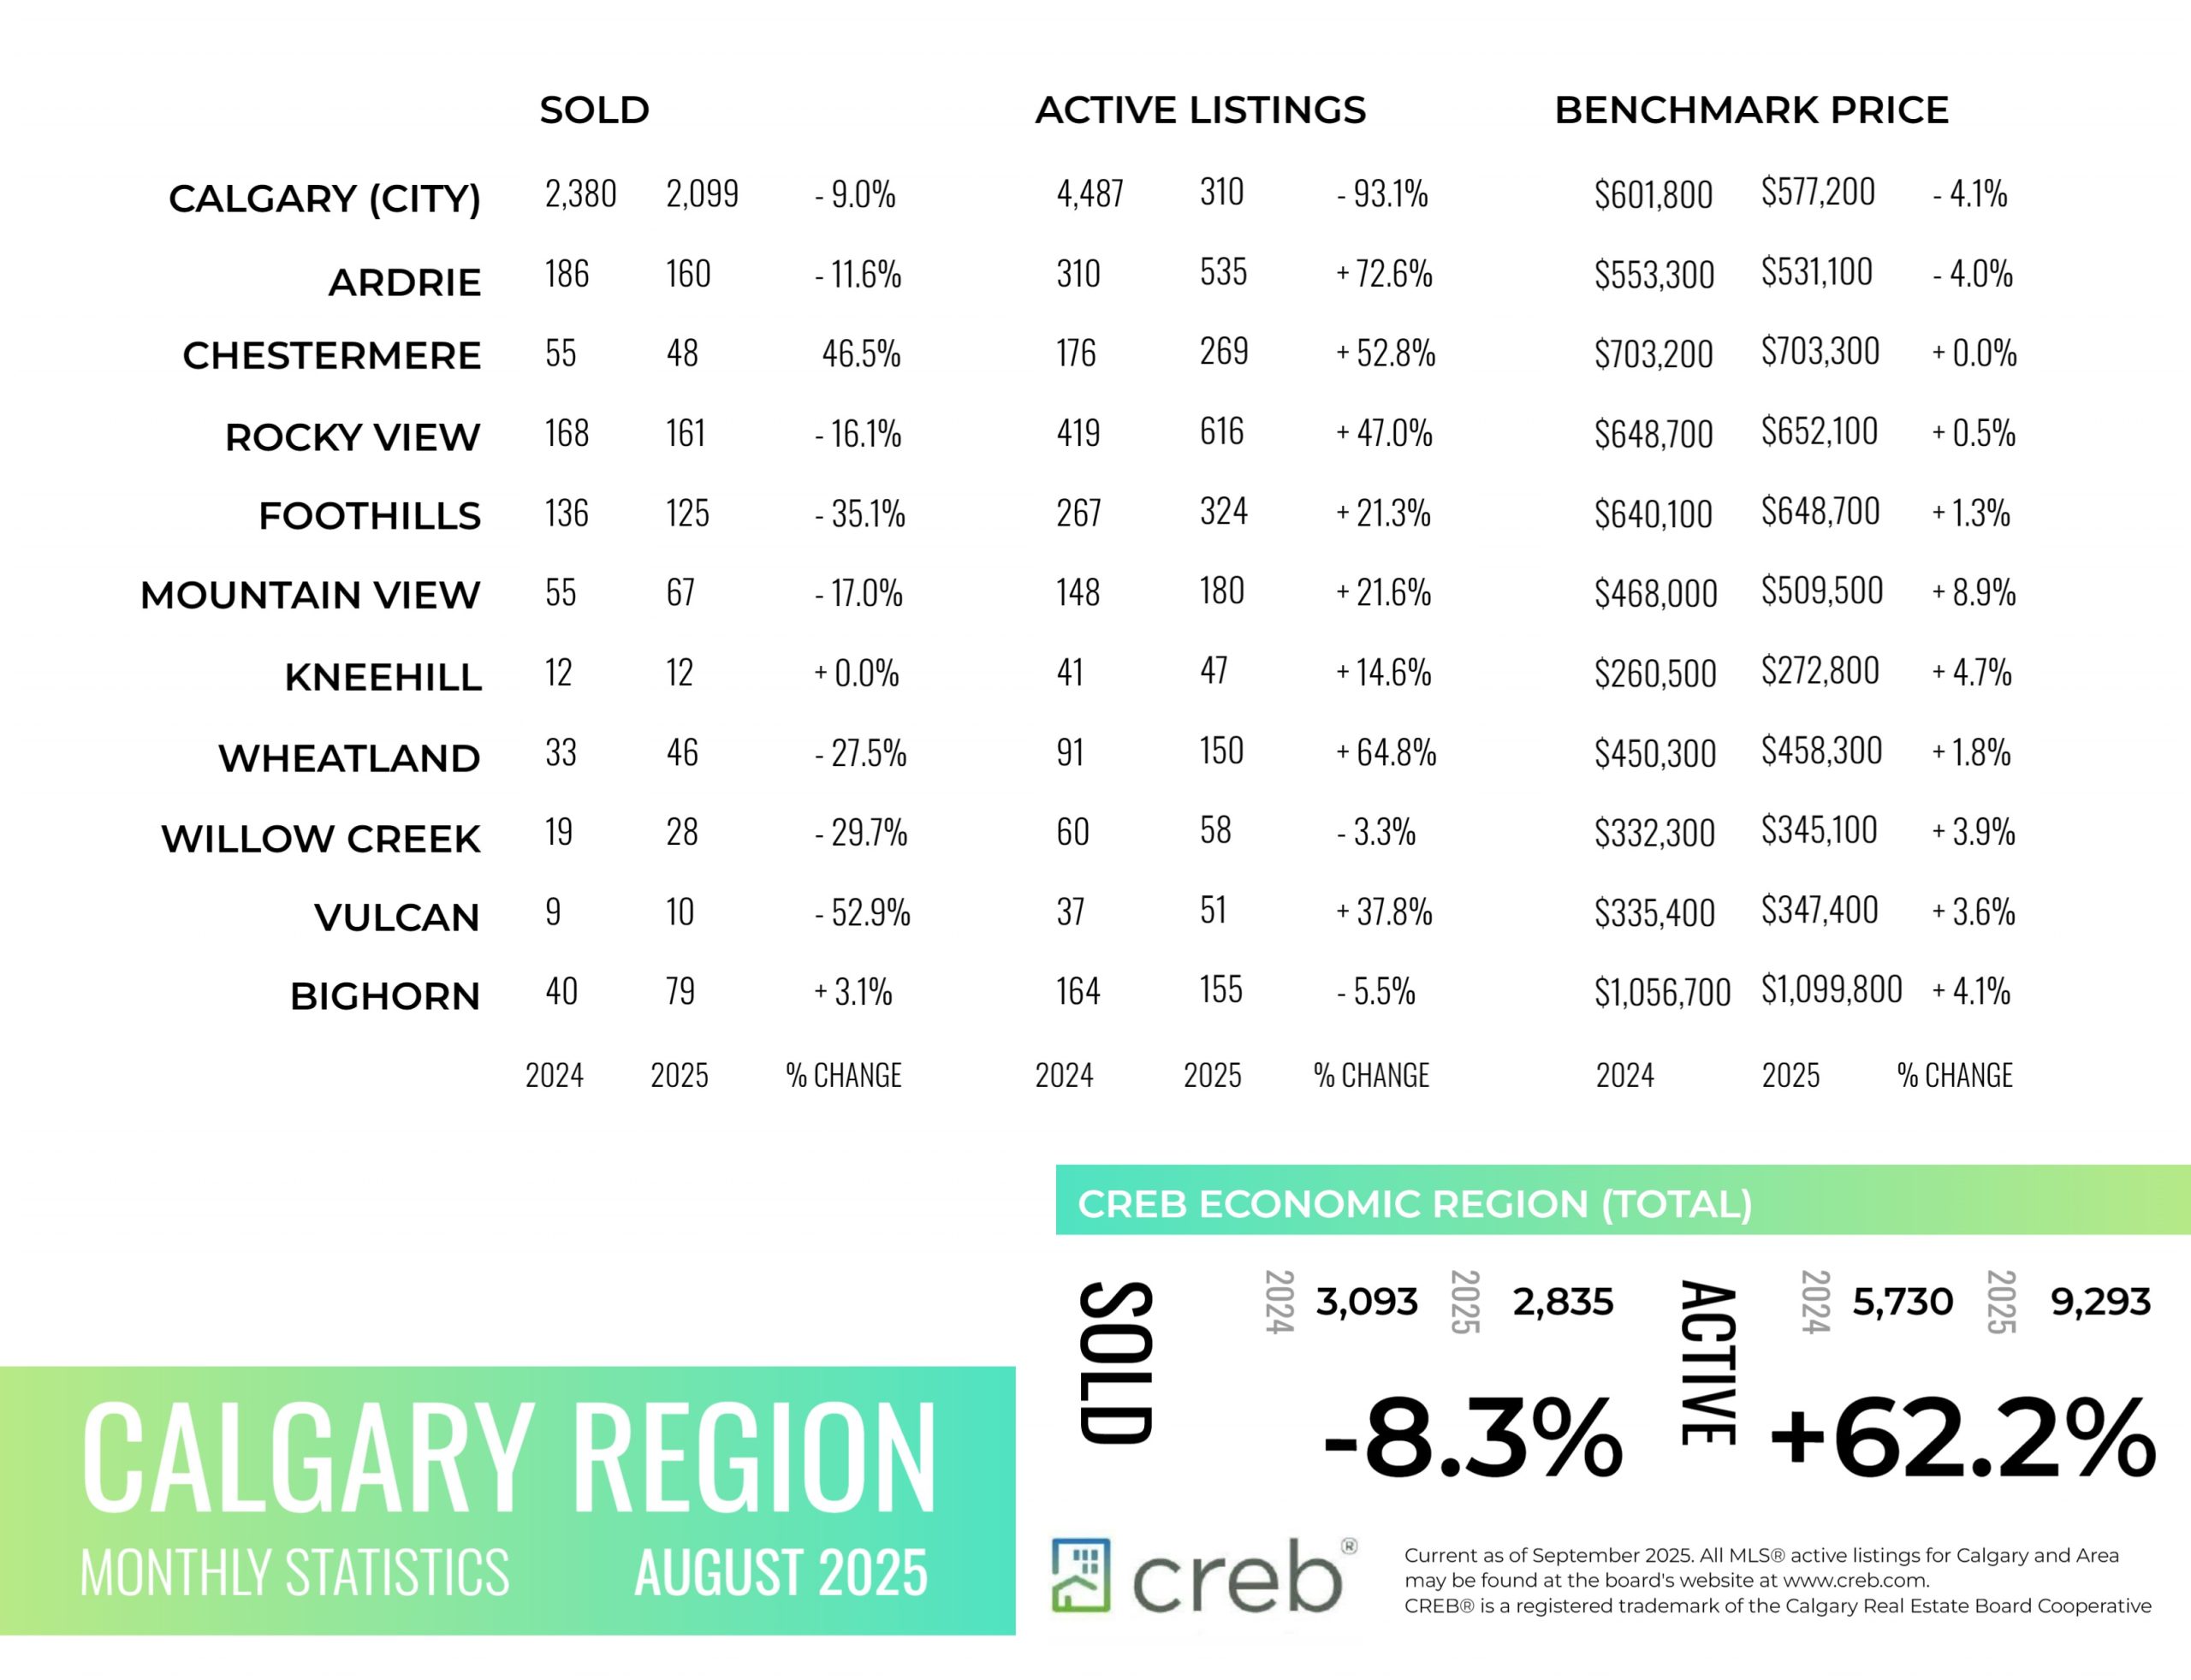
Higher price adjustments are occurring for apartment and row style properties while detached and semi-detached properties have reported modest declines. As of August, the unadjusted total residential benchmark price was $577,200, down over last month and nearly four per cent lower than levels reported last year.
“Perspective is needed when it comes to price adjustments. The most significant price adjustments are occurring for row and apartment style homes as they are also the product type that are facing the largest gains in supply choice,” said Ann-Marie Lurie, Chief Economist at CREB®. “Meanwhile price adjustments in the detached and semi-detached markets range from modest price growth in some areas to larger price declines in areas with large supply growth. Overall, recent price adjustments have not offset all the gains that have occurred over the past several years.”
August reported 1,989 sales, nearly nine per cent lower than last year. Sales have slowed compared to the high levels reported over the past four years. However, activity is still above long-term trends, reflecting relatively strong demand. What has changed is the supply situation. New listings remain elevated, keeping the sales-to-new-listings ratio below 60 per cent and pushing inventory to 6,661, the highest August amount since 2019.
Read the full report on the CREB website!
The following data is a comparison between August 2025 and August 2024 numbers, and is current as of September of 2025. For last month’s numbers, check out our previous infographic.
Or follow this link for all our CREB Infographics!
Click on the images for a larger view!
Download Printable Version – August 2025 CREB, City of Calgary Report Pages 1 and 2
Download Printable Version – August 2025 CREB, Calgary Region Report
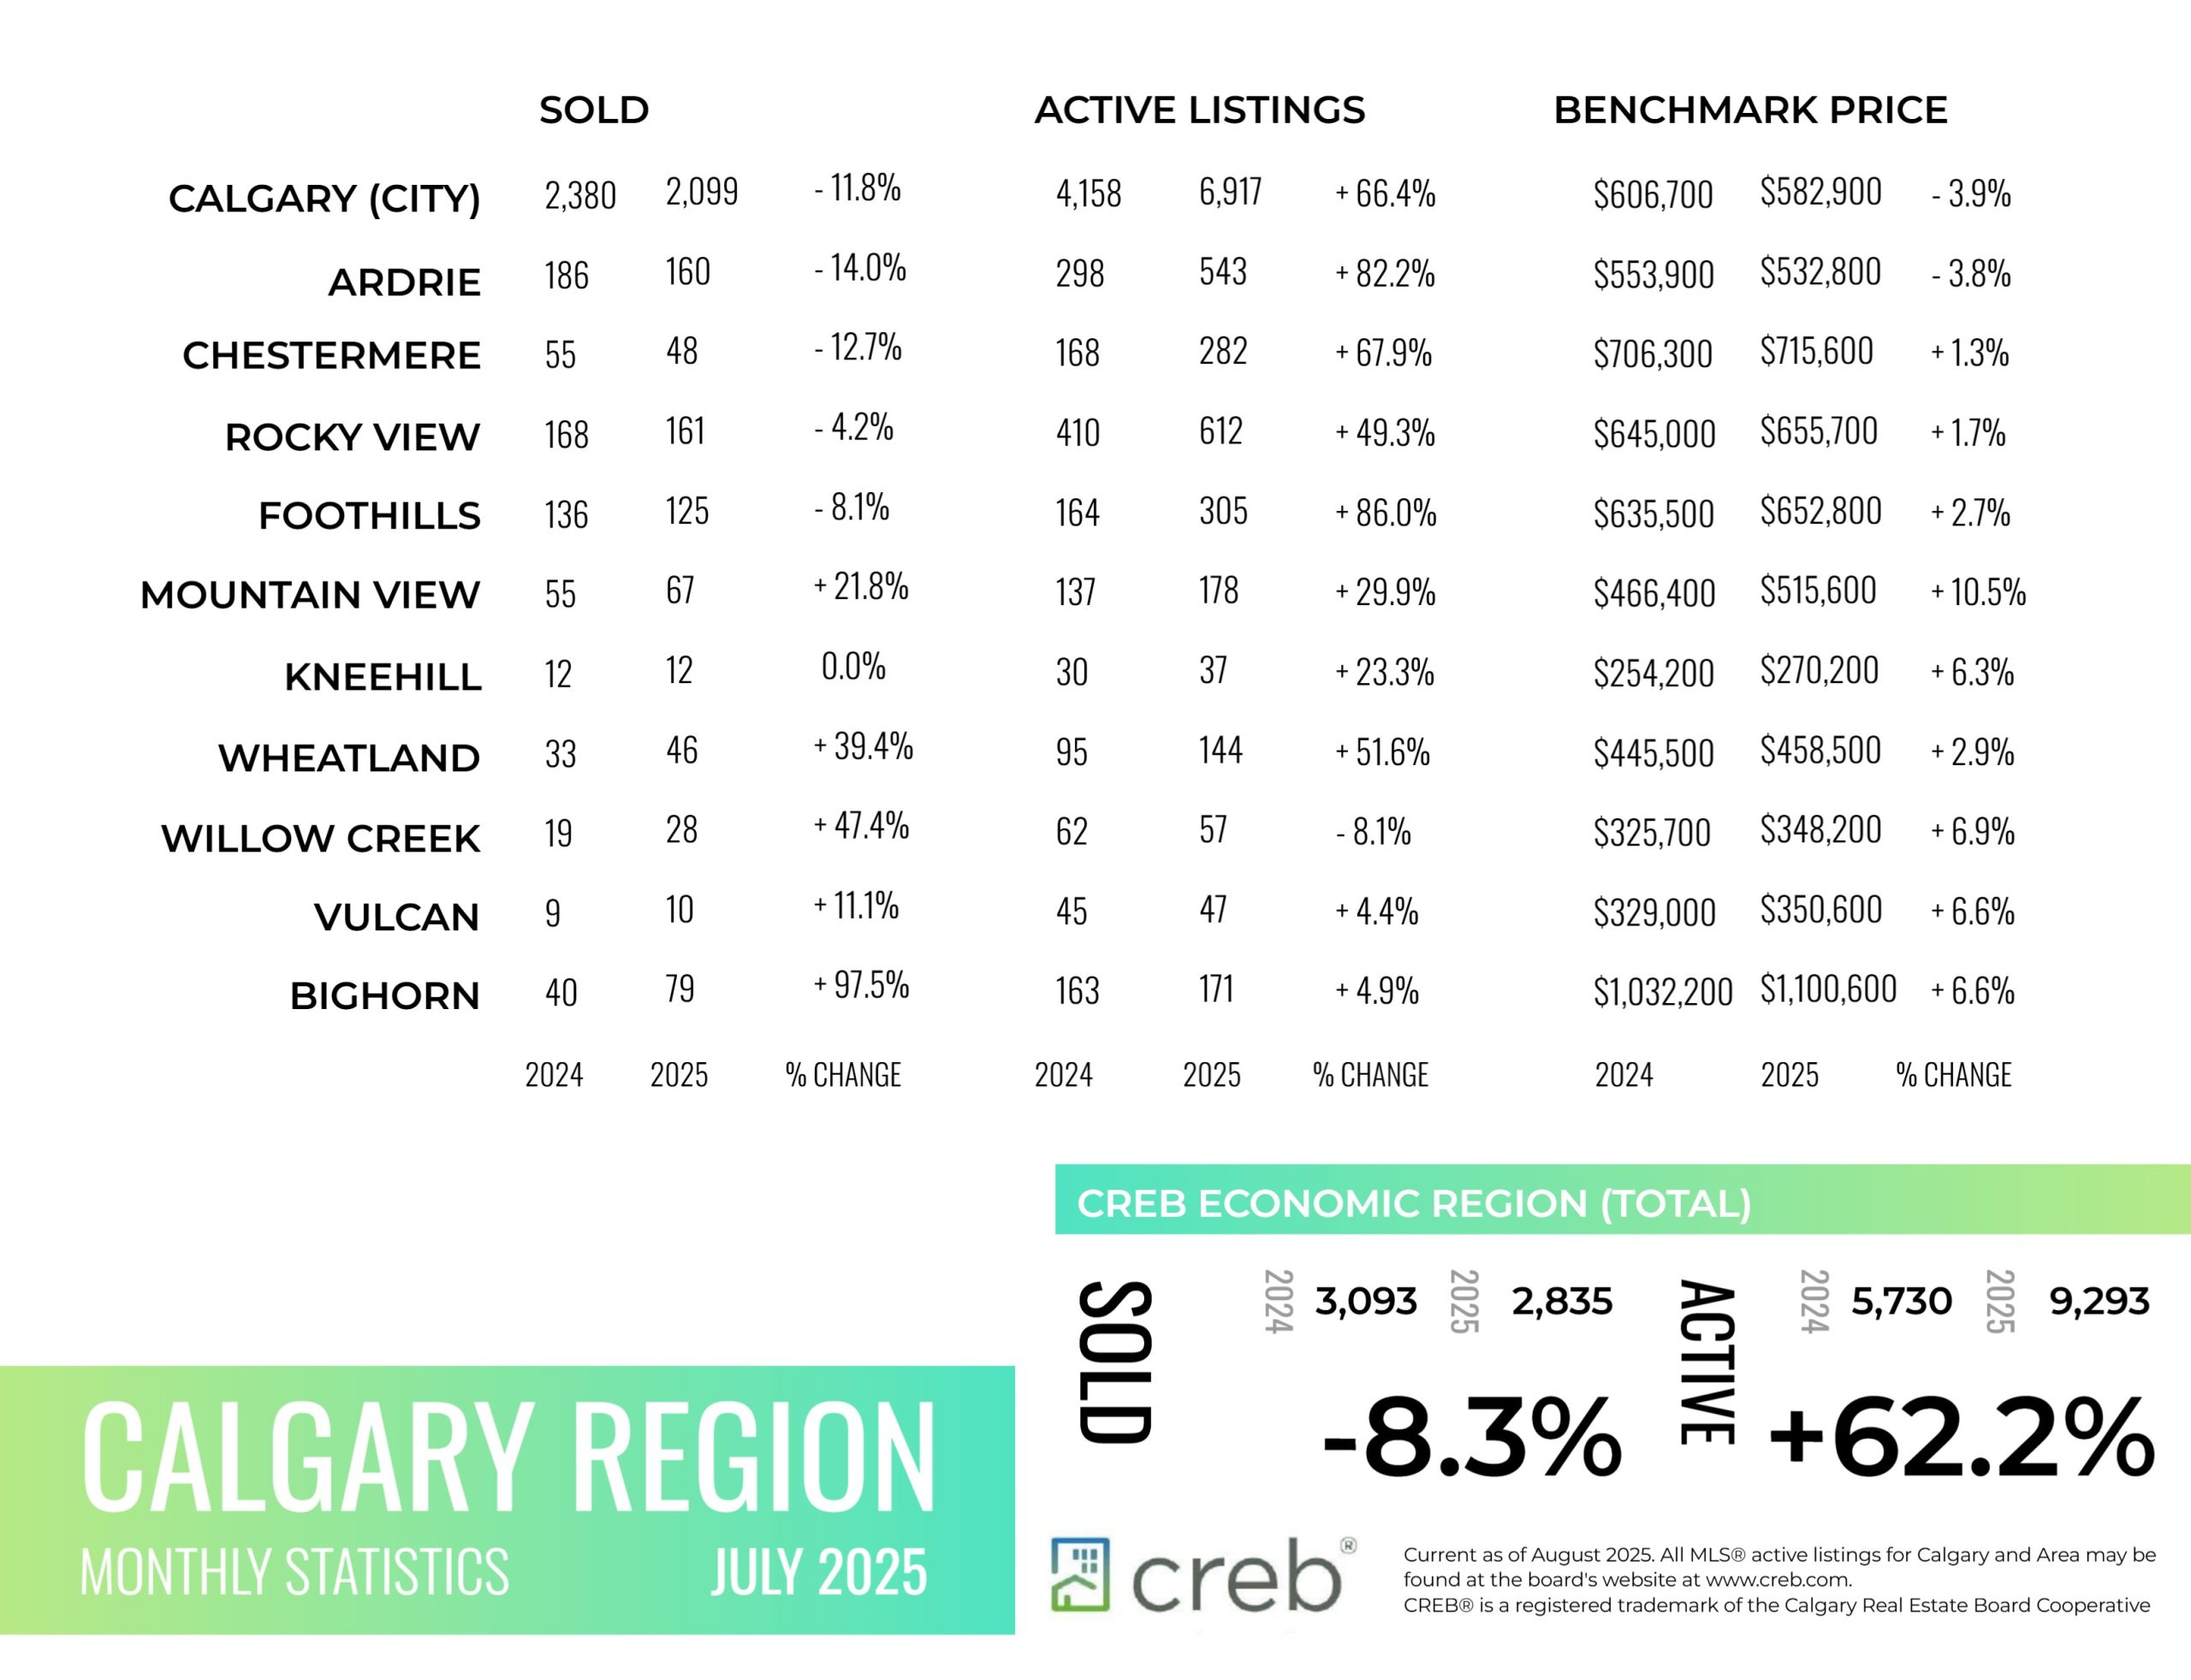
INFOGRAPHICS: July 2025 CREB City And Region Market Reports

Supply growth weighs on home prices
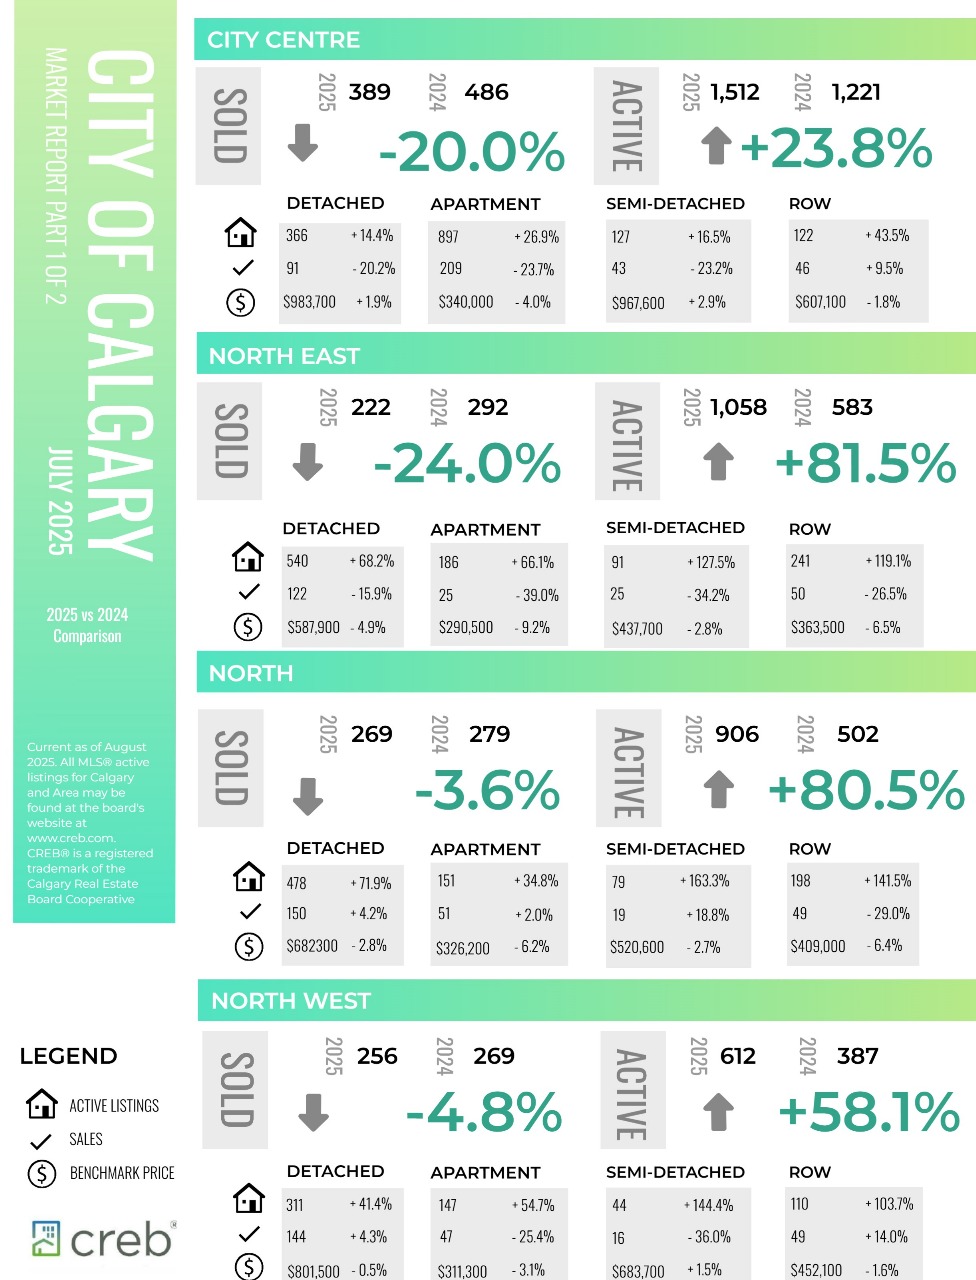
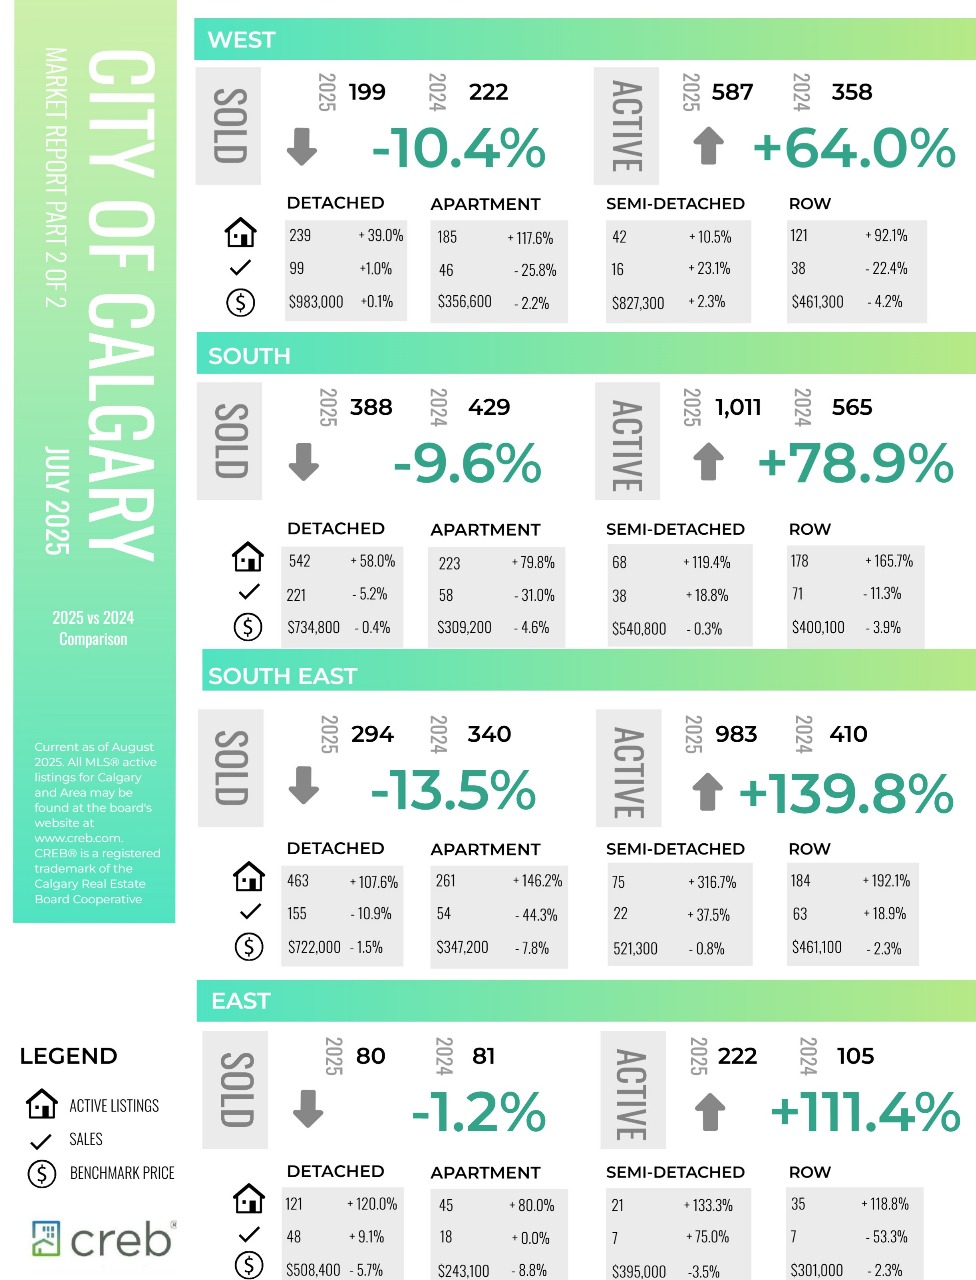
Thanks to gains mostly occurring in the newer communities, inventory levels in July were 6,917 units, reaching levels not seen since prior to the pandemic and higher than long-term trends. While supply has improved across all property types and all districts, the largest gains are occurring in the areas where there has been new community growth.
The additional supply has weighed on home prices in some parts of the city. The total residential benchmark price in Calgary has trended down over the past several months and is currently four per cent below last year’s peak price reported in June 2024.
“Price declines are not occurring across all property types in all locations of the city, and even where there have been declines, it has not erased all the gains made over the past several years,” said Ann-Marie Lurie, Chief Economist at CREB®. “The steepest price declines have occurred for apartment and row style homes, mostly in the North East and North districts, which coincides with significant gains in new supply.”
The rise in supply occurred as sales continued to slow and new listings improved. In July, there were 2,099 sales, a 12 per cent decline over last year, while new listings reached 3,911 units, an over eight per cent increase over last year. In addition to the persistent economic uncertainty due to tariffs, sales and new listings were impacted by no further reductions in lending rates and added competition from the new home market. Apartment-style homes are reporting the highest months of supply with over four months, while both detached and semi-detached homes are seeing conditions remain relatively balanced at just three months of supply.
Read the full report on the CREB website!
The following data is a comparison between July 2025 and July 2024 numbers, and is current as of August of 2025. For last month’s numbers, check out our previous infographic.
Or follow this link for all our CREB Infographics!
Click on the images for a larger view!
Download Printable Version – July 2025 CREB, City of Calgary Report Pages 1 and 2
Download Printable Version – July 2025 CREB, Calgary Region Report
INFOGRAPHICS: June 2025 CREB City And Region Market Reports

Gains in resale supply mostly impact apartment and row style home prices
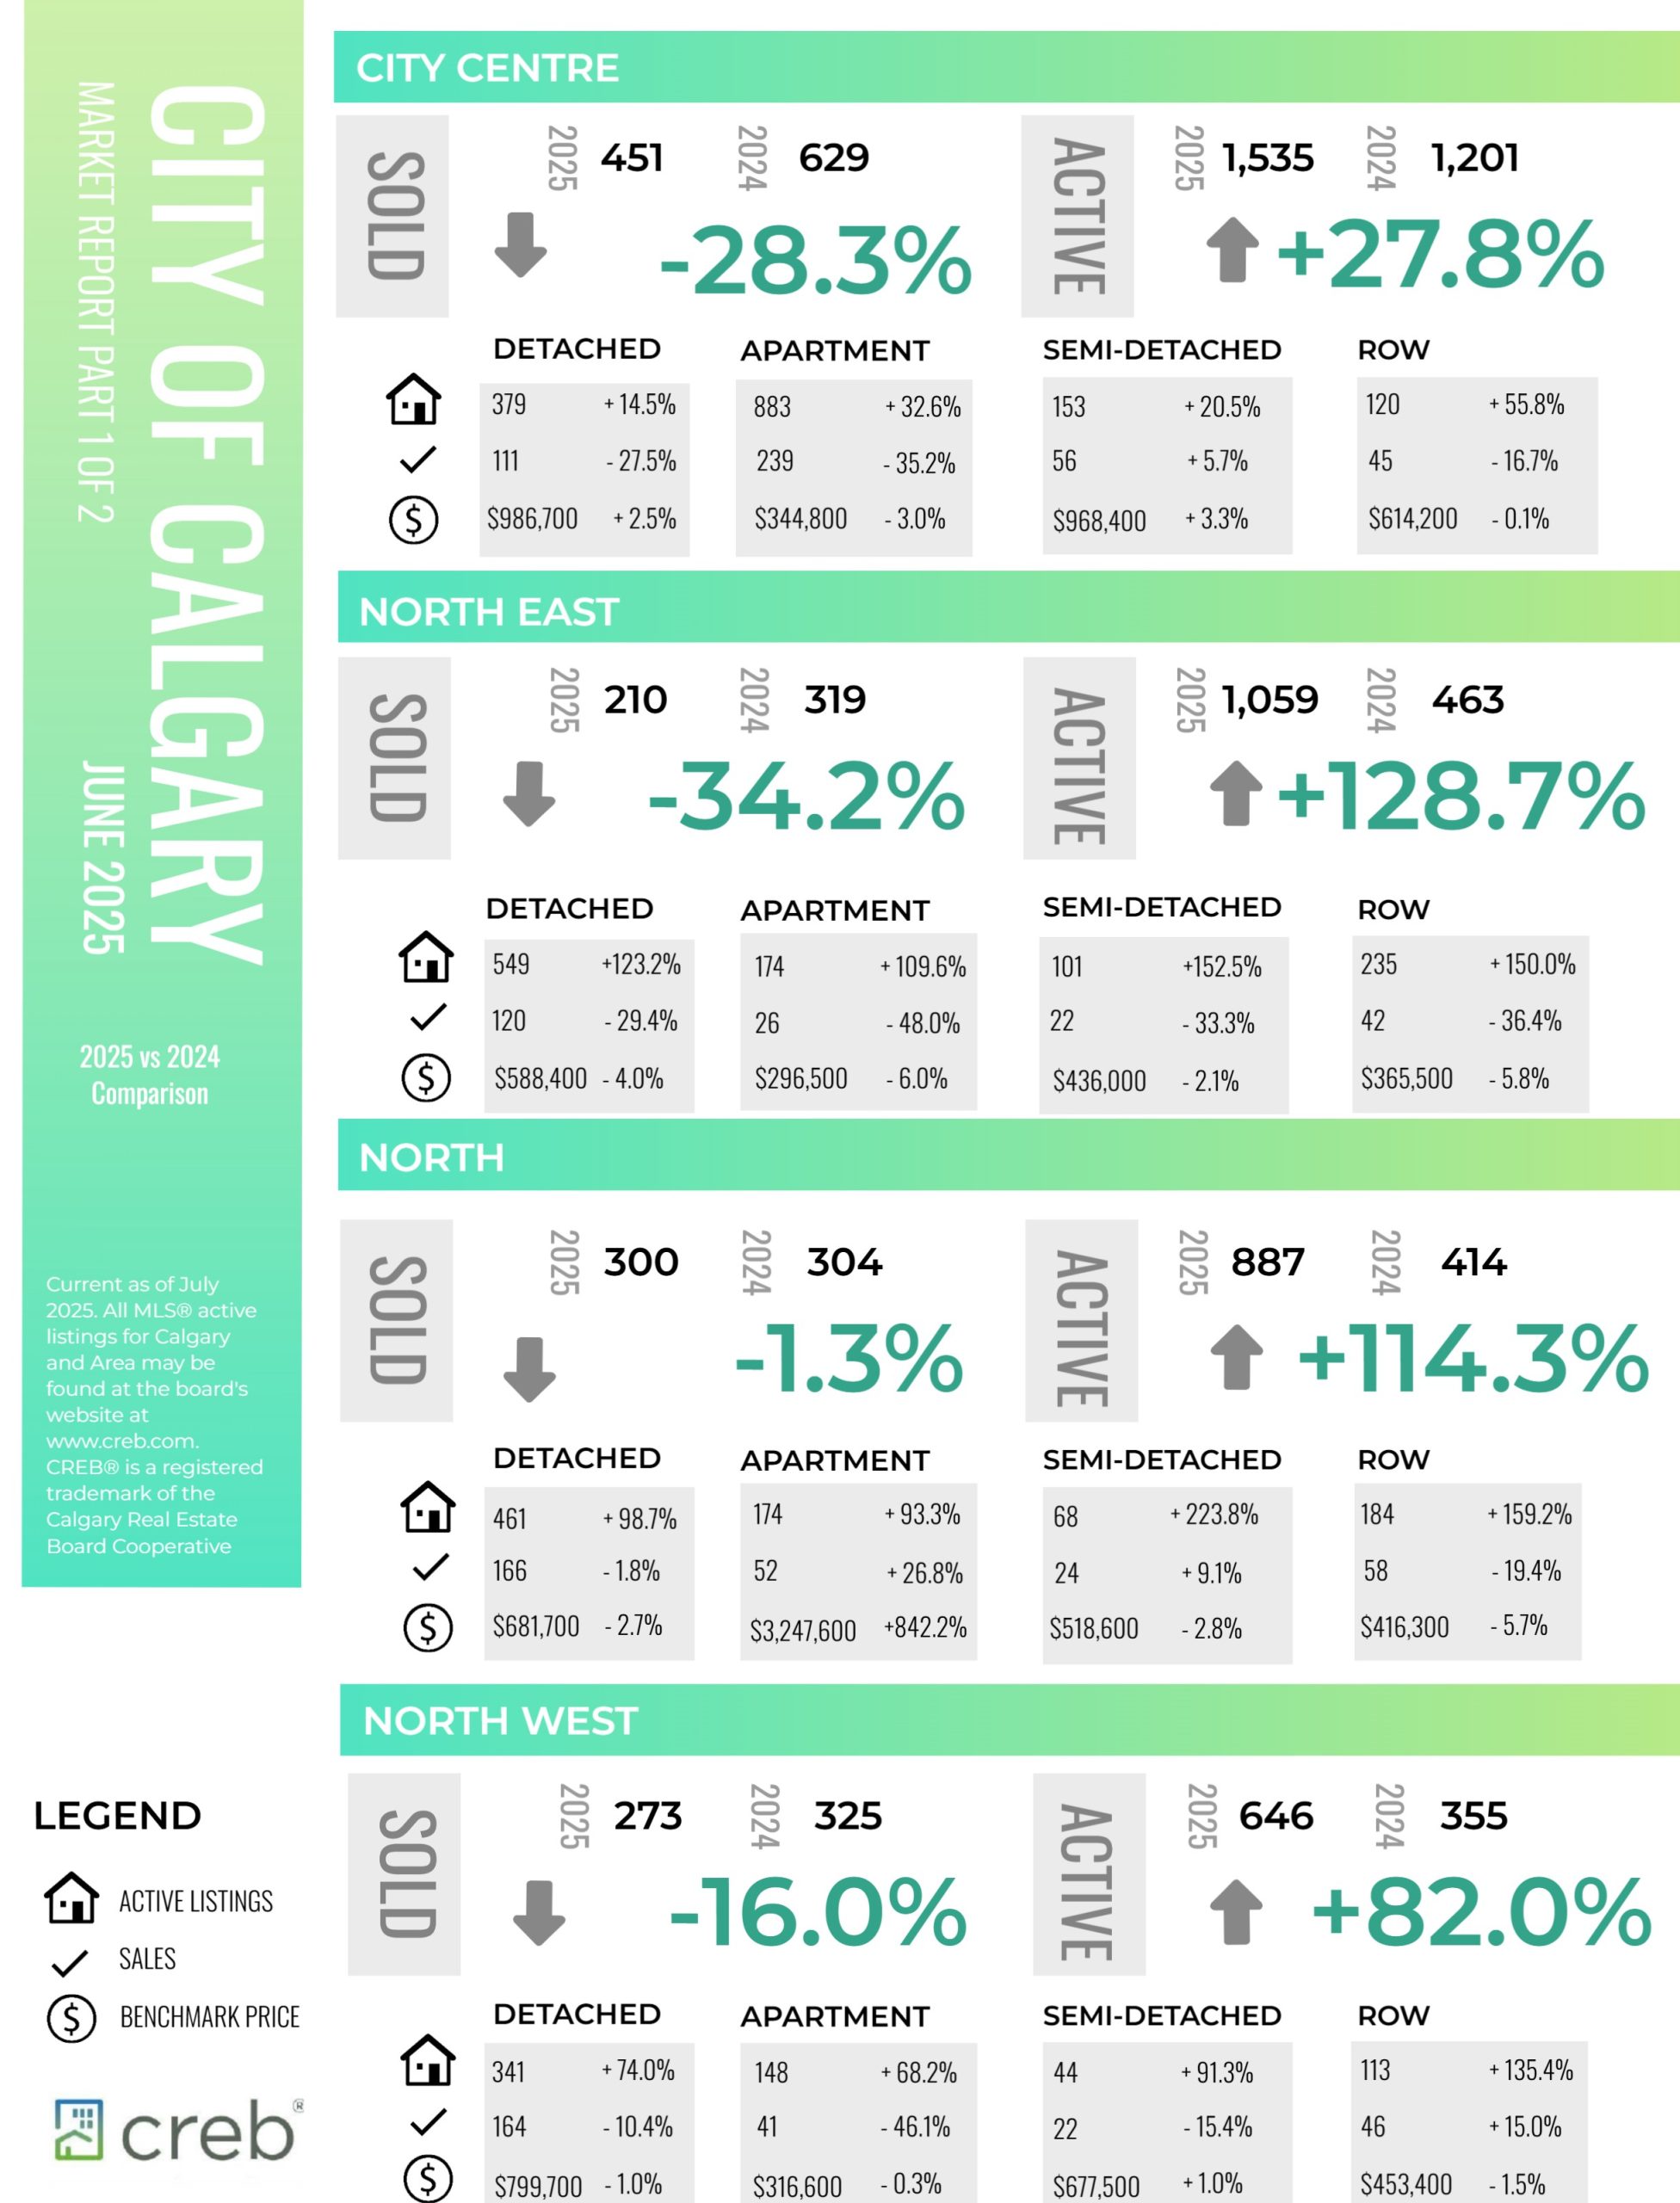
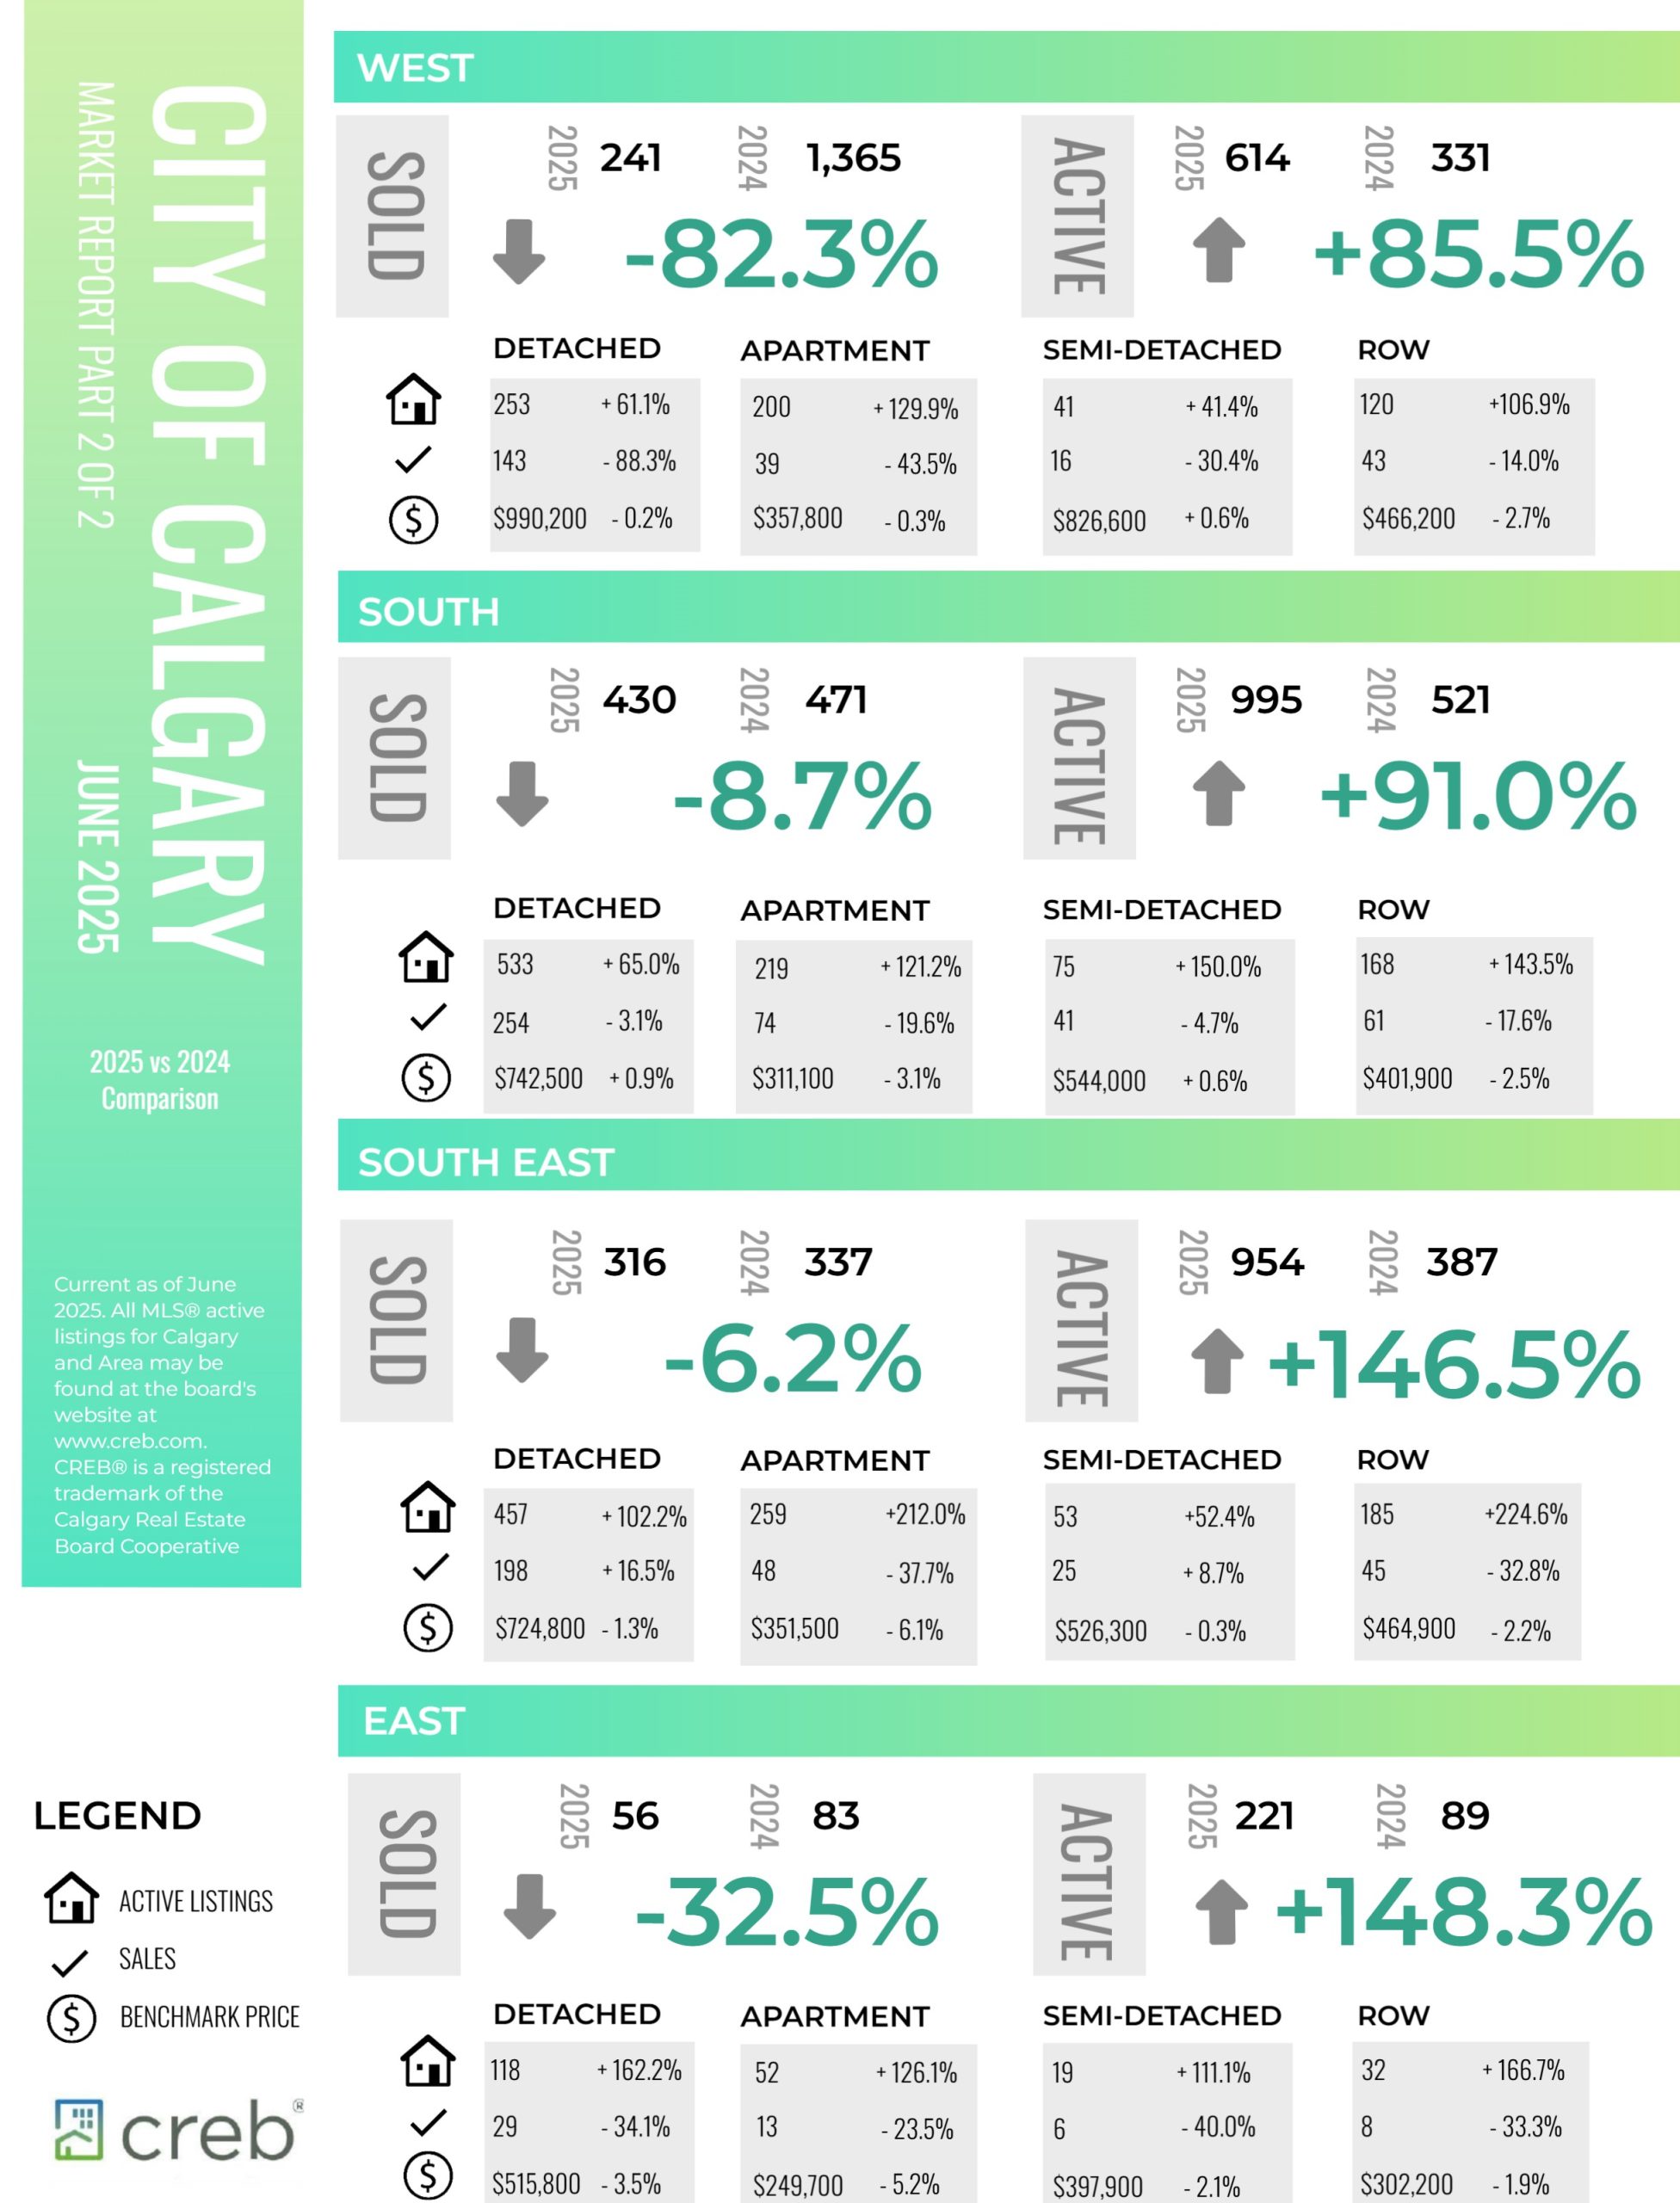
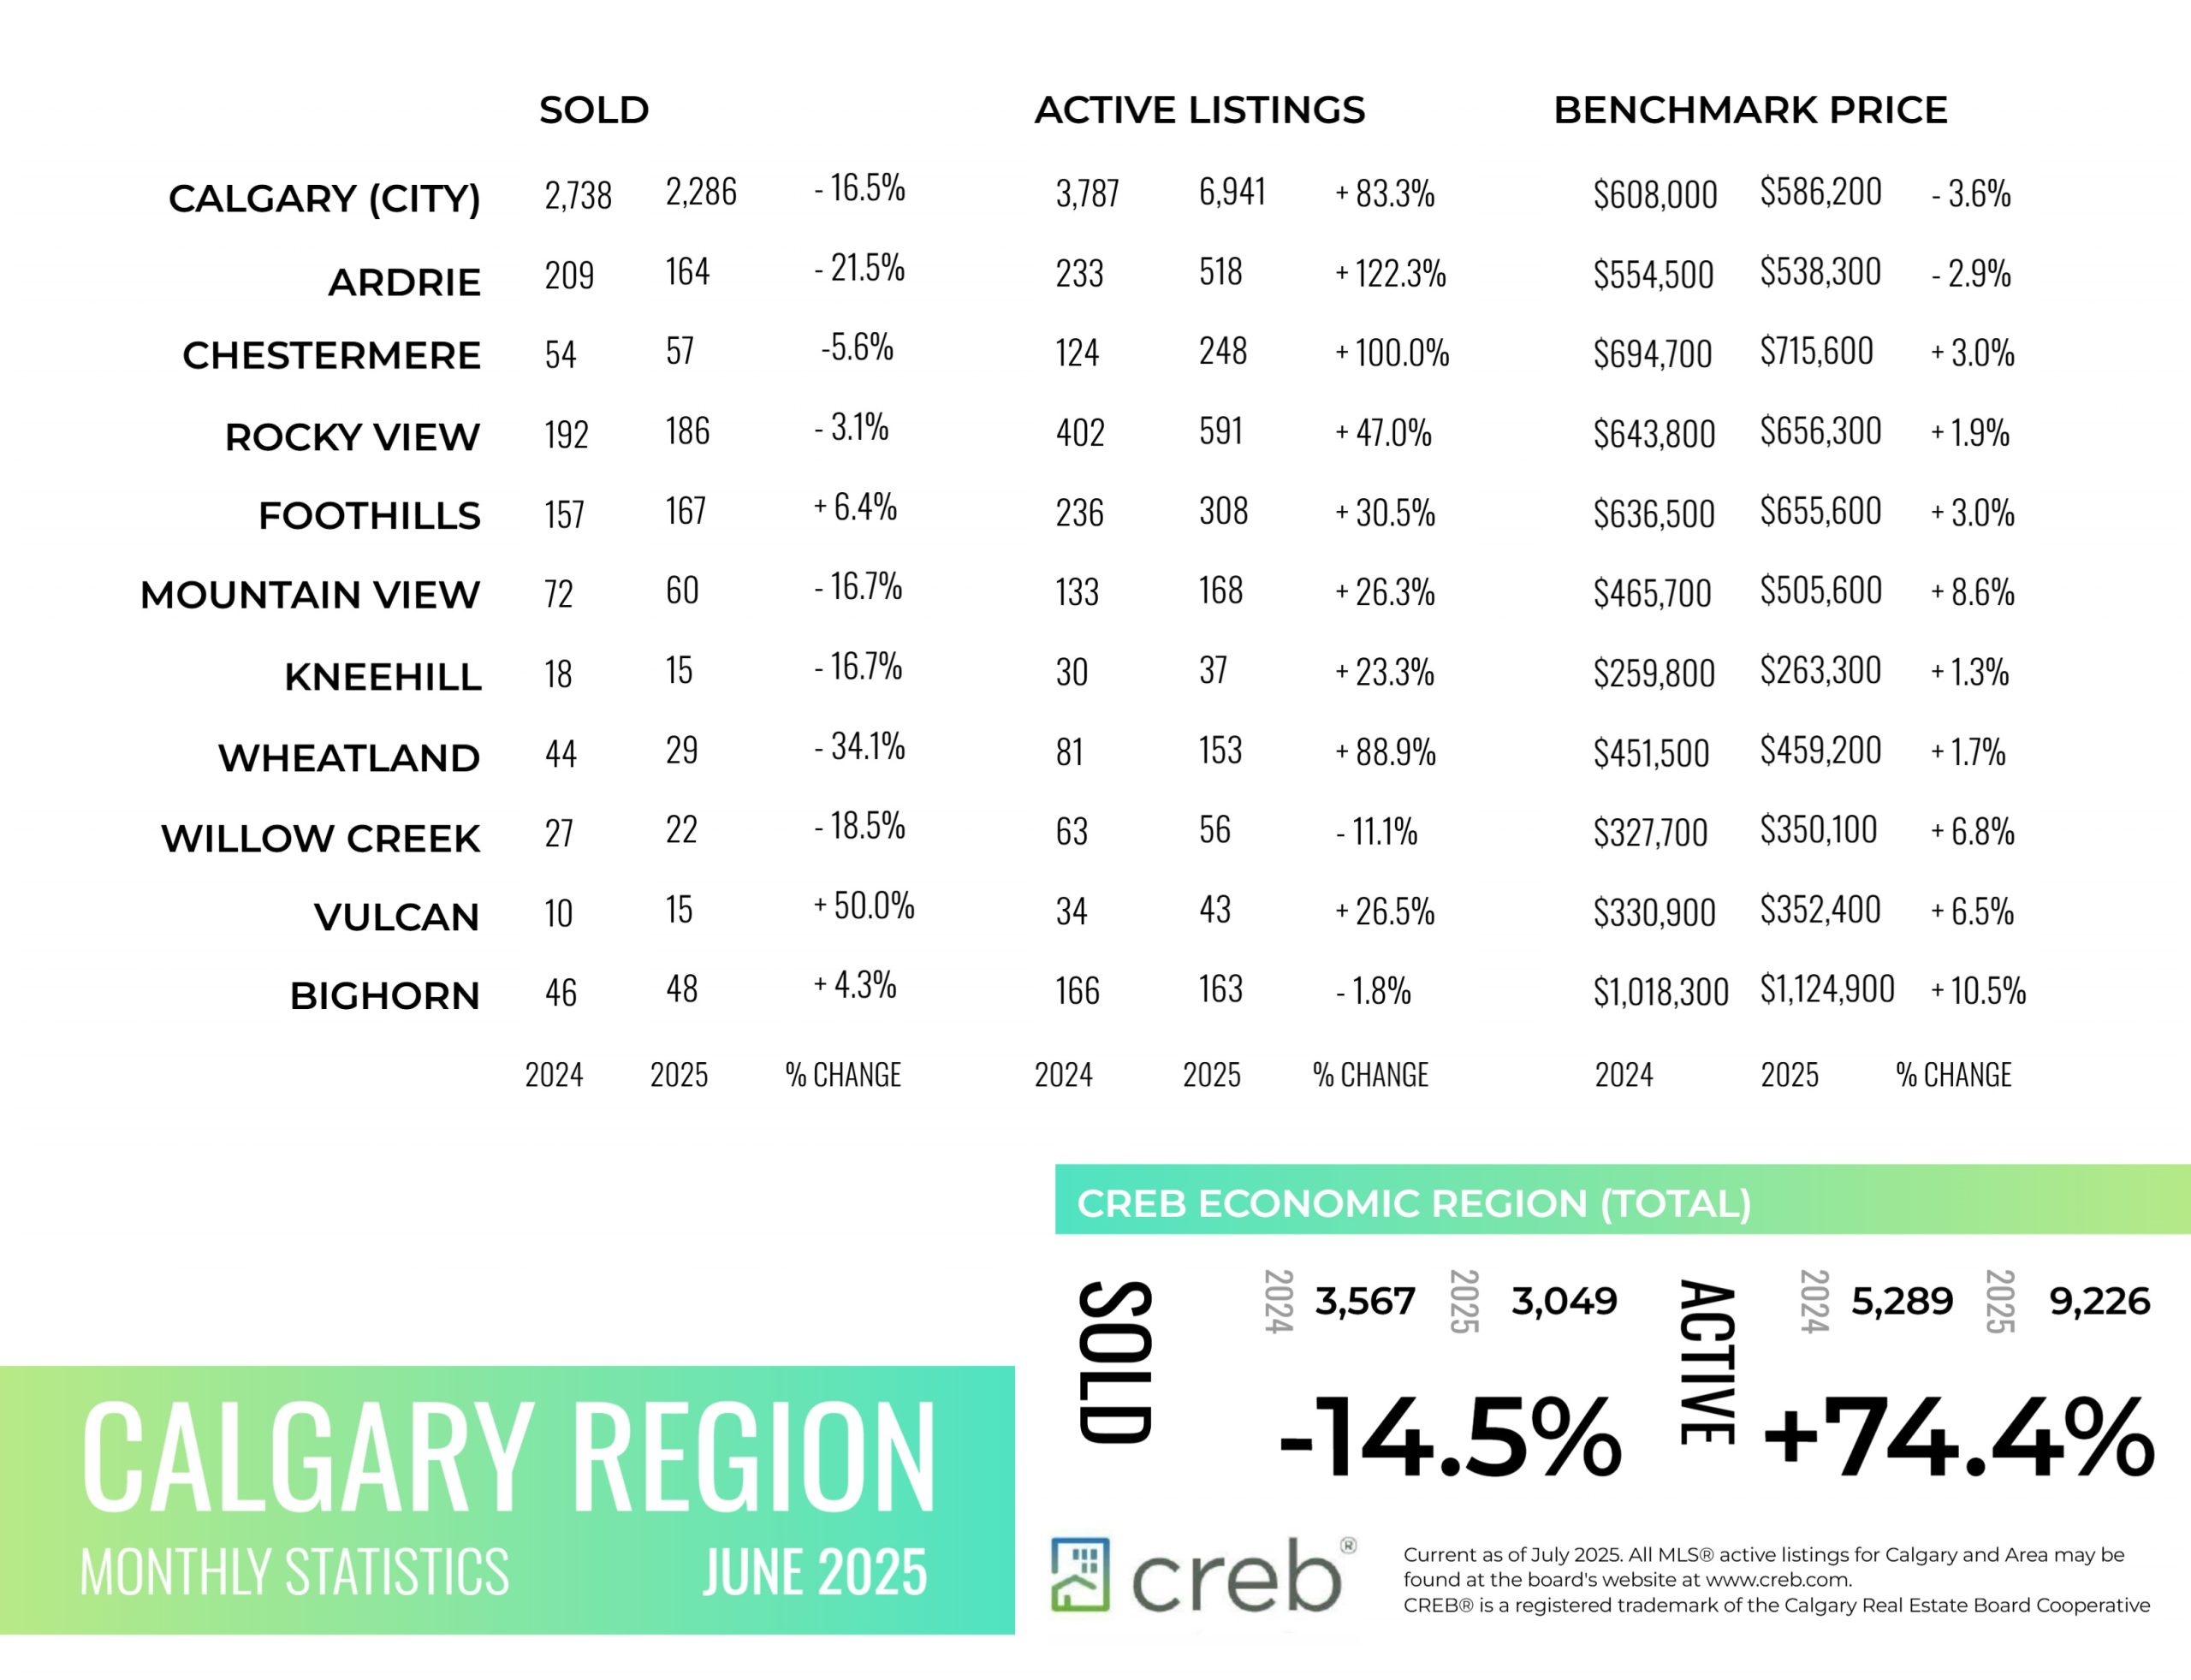
Inventory levels in June continued to rise, both over last month and last year’s levels. By the end of the month inventory reached 6,941 units, returning to levels reported in 2021, or prior to the surge in population growth. While sales have remained consistent with long-term trends despite a decline from recent months, higher levels of new listings
compared to sales have contributed to the inventory gain. All property types have reported gains in inventory, but both row and apartment style homes reported inventory levels over 30 per cent higher than long term trends, while supply for detached and semi-detached units are only slightly higher than typical levels.
“Supply has improved across rental, resale and new home markets, allowing for more choice for those considering their housing options,” said Ann-Marie Lurie, Chief Economist at CREB®. “The additional choice combined with no further declines in lending rates, persistent uncertainty and concerns of price adjustments is keeping many potential purchasers on the sidelines. This is weighing on home prices, especially for apartment and row style homes.”
Read the full report on the CREB website!
The following data is a comparison between June 2025 and June 2024 numbers, and is current as of July of 2025. For last month’s numbers, check out our previous infographic.
Or follow this link for all our CREB Infographics!
Click on the images for a larger view!
Download Printable Version – June 2025 CREB, City of Calgary Report Pages 1 and 2
Download Printable Version – June 2025 CREB, Calgary Region Report
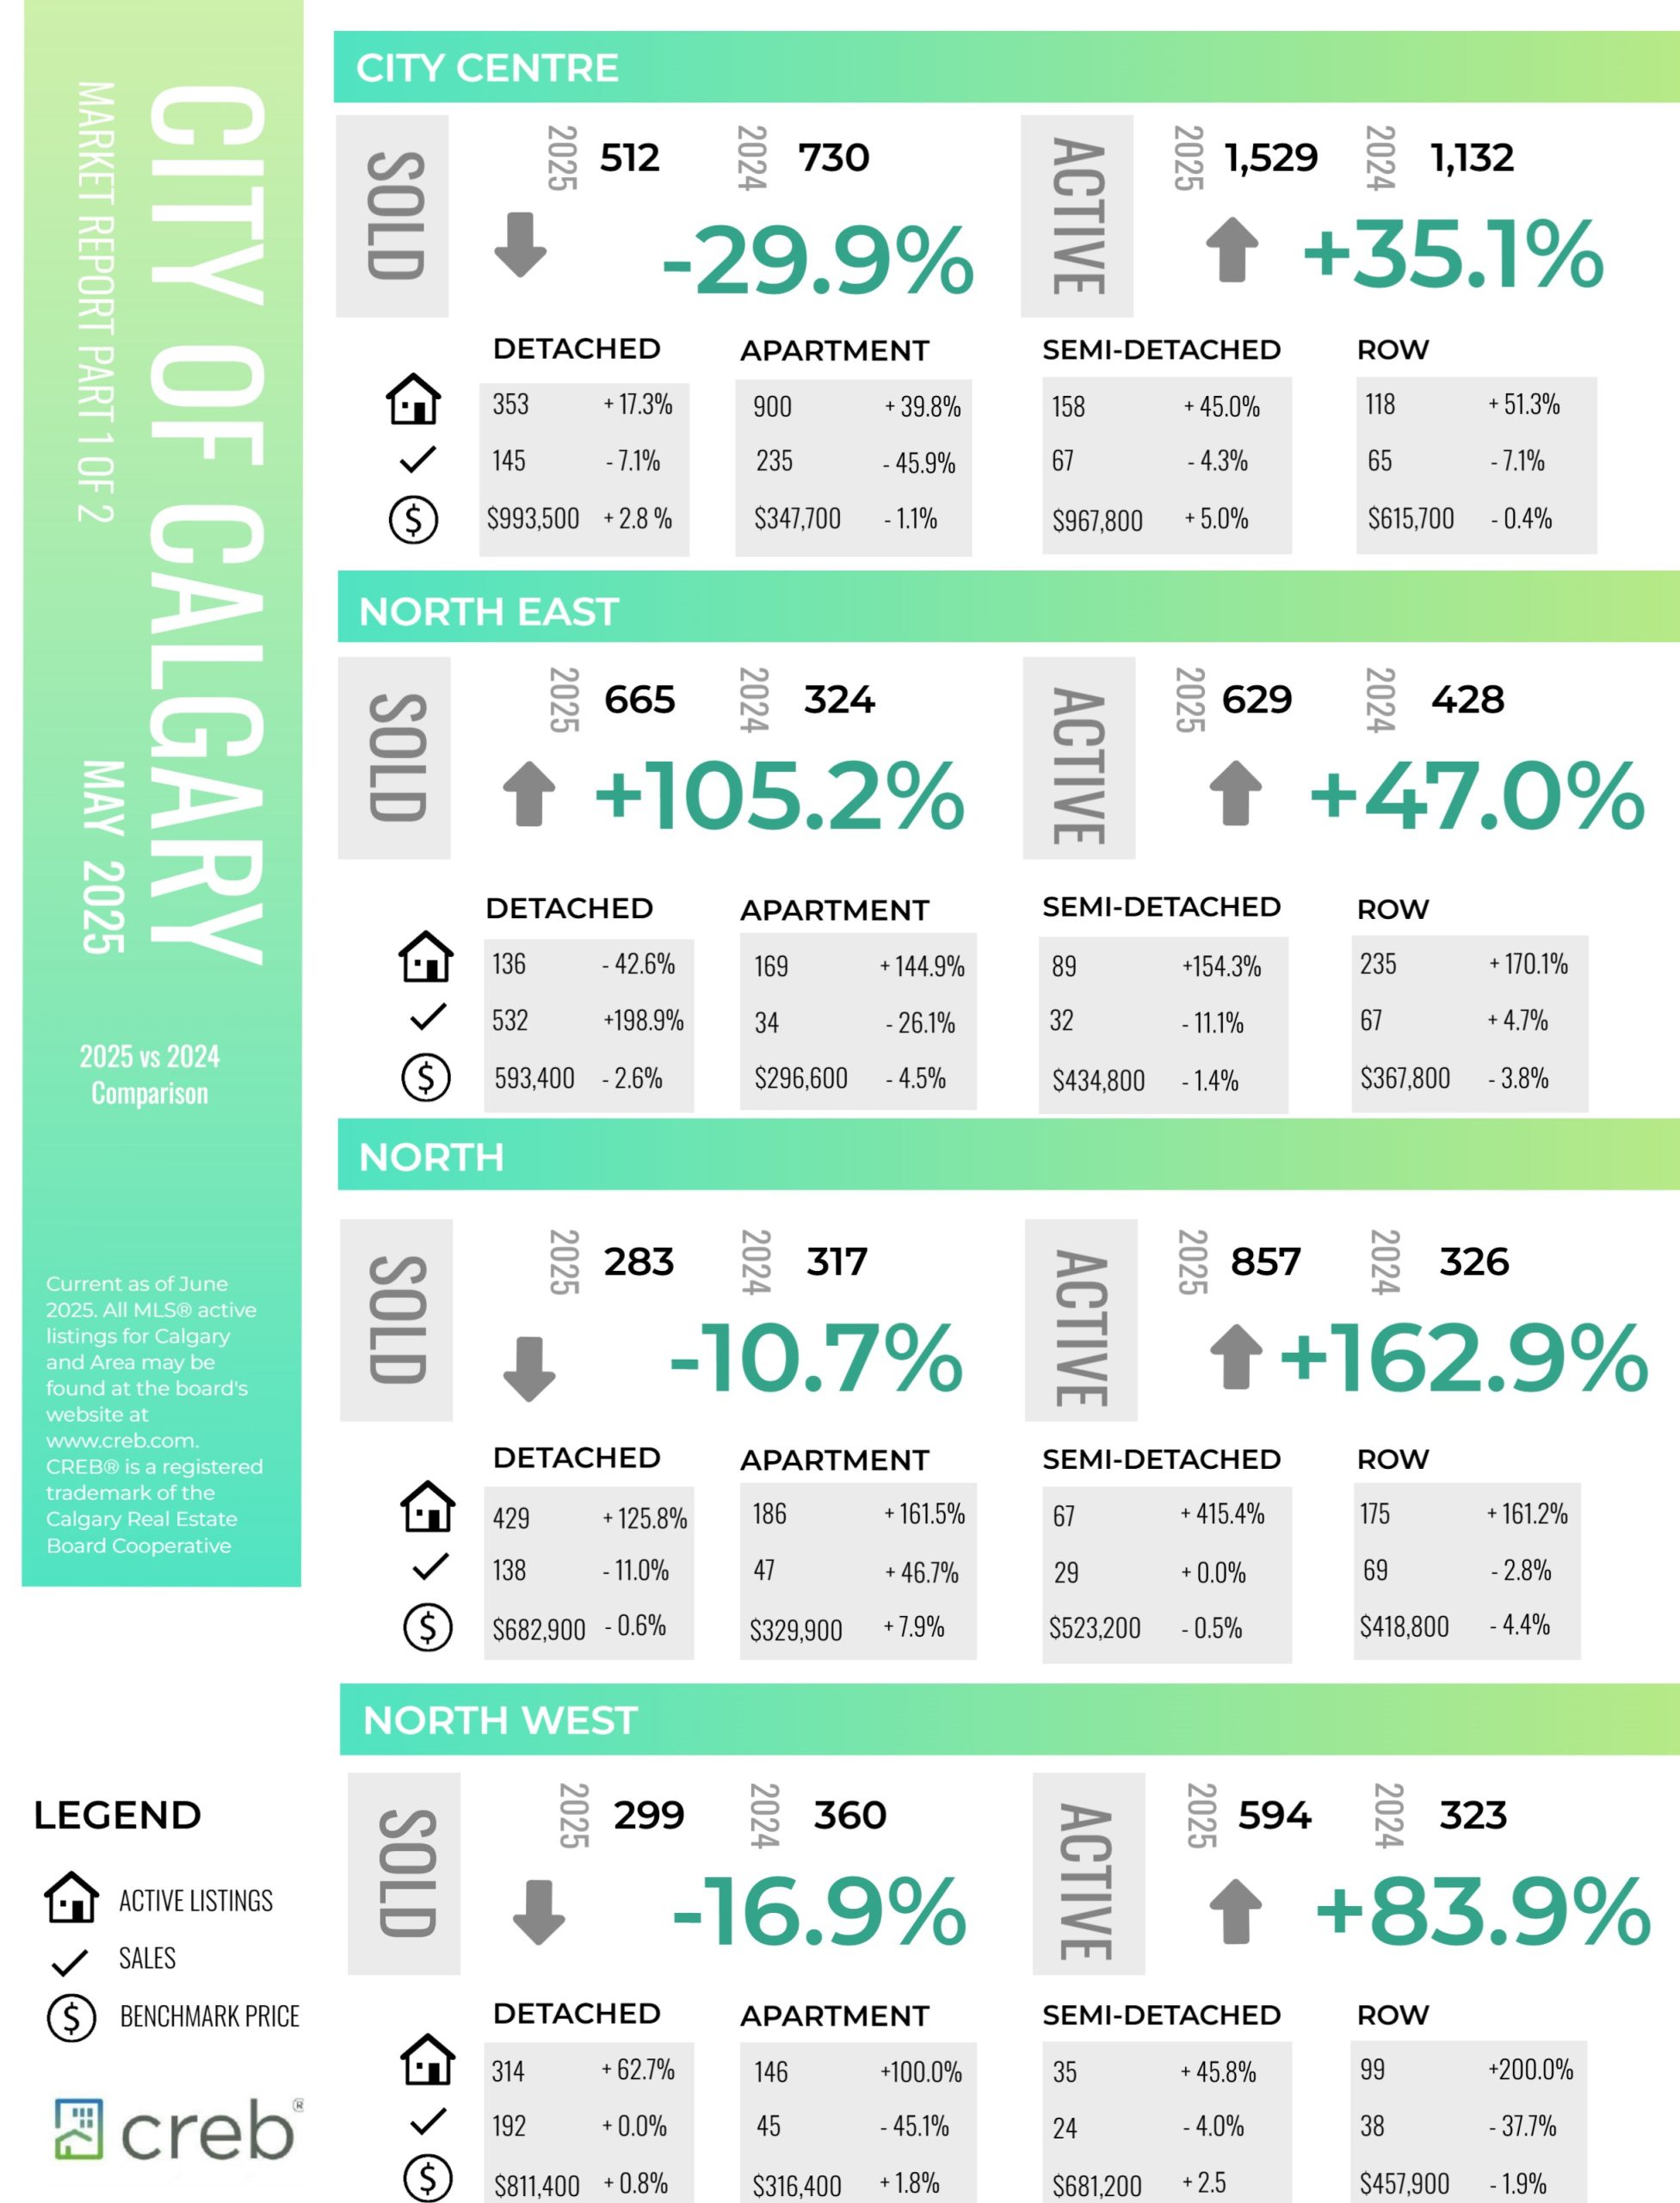
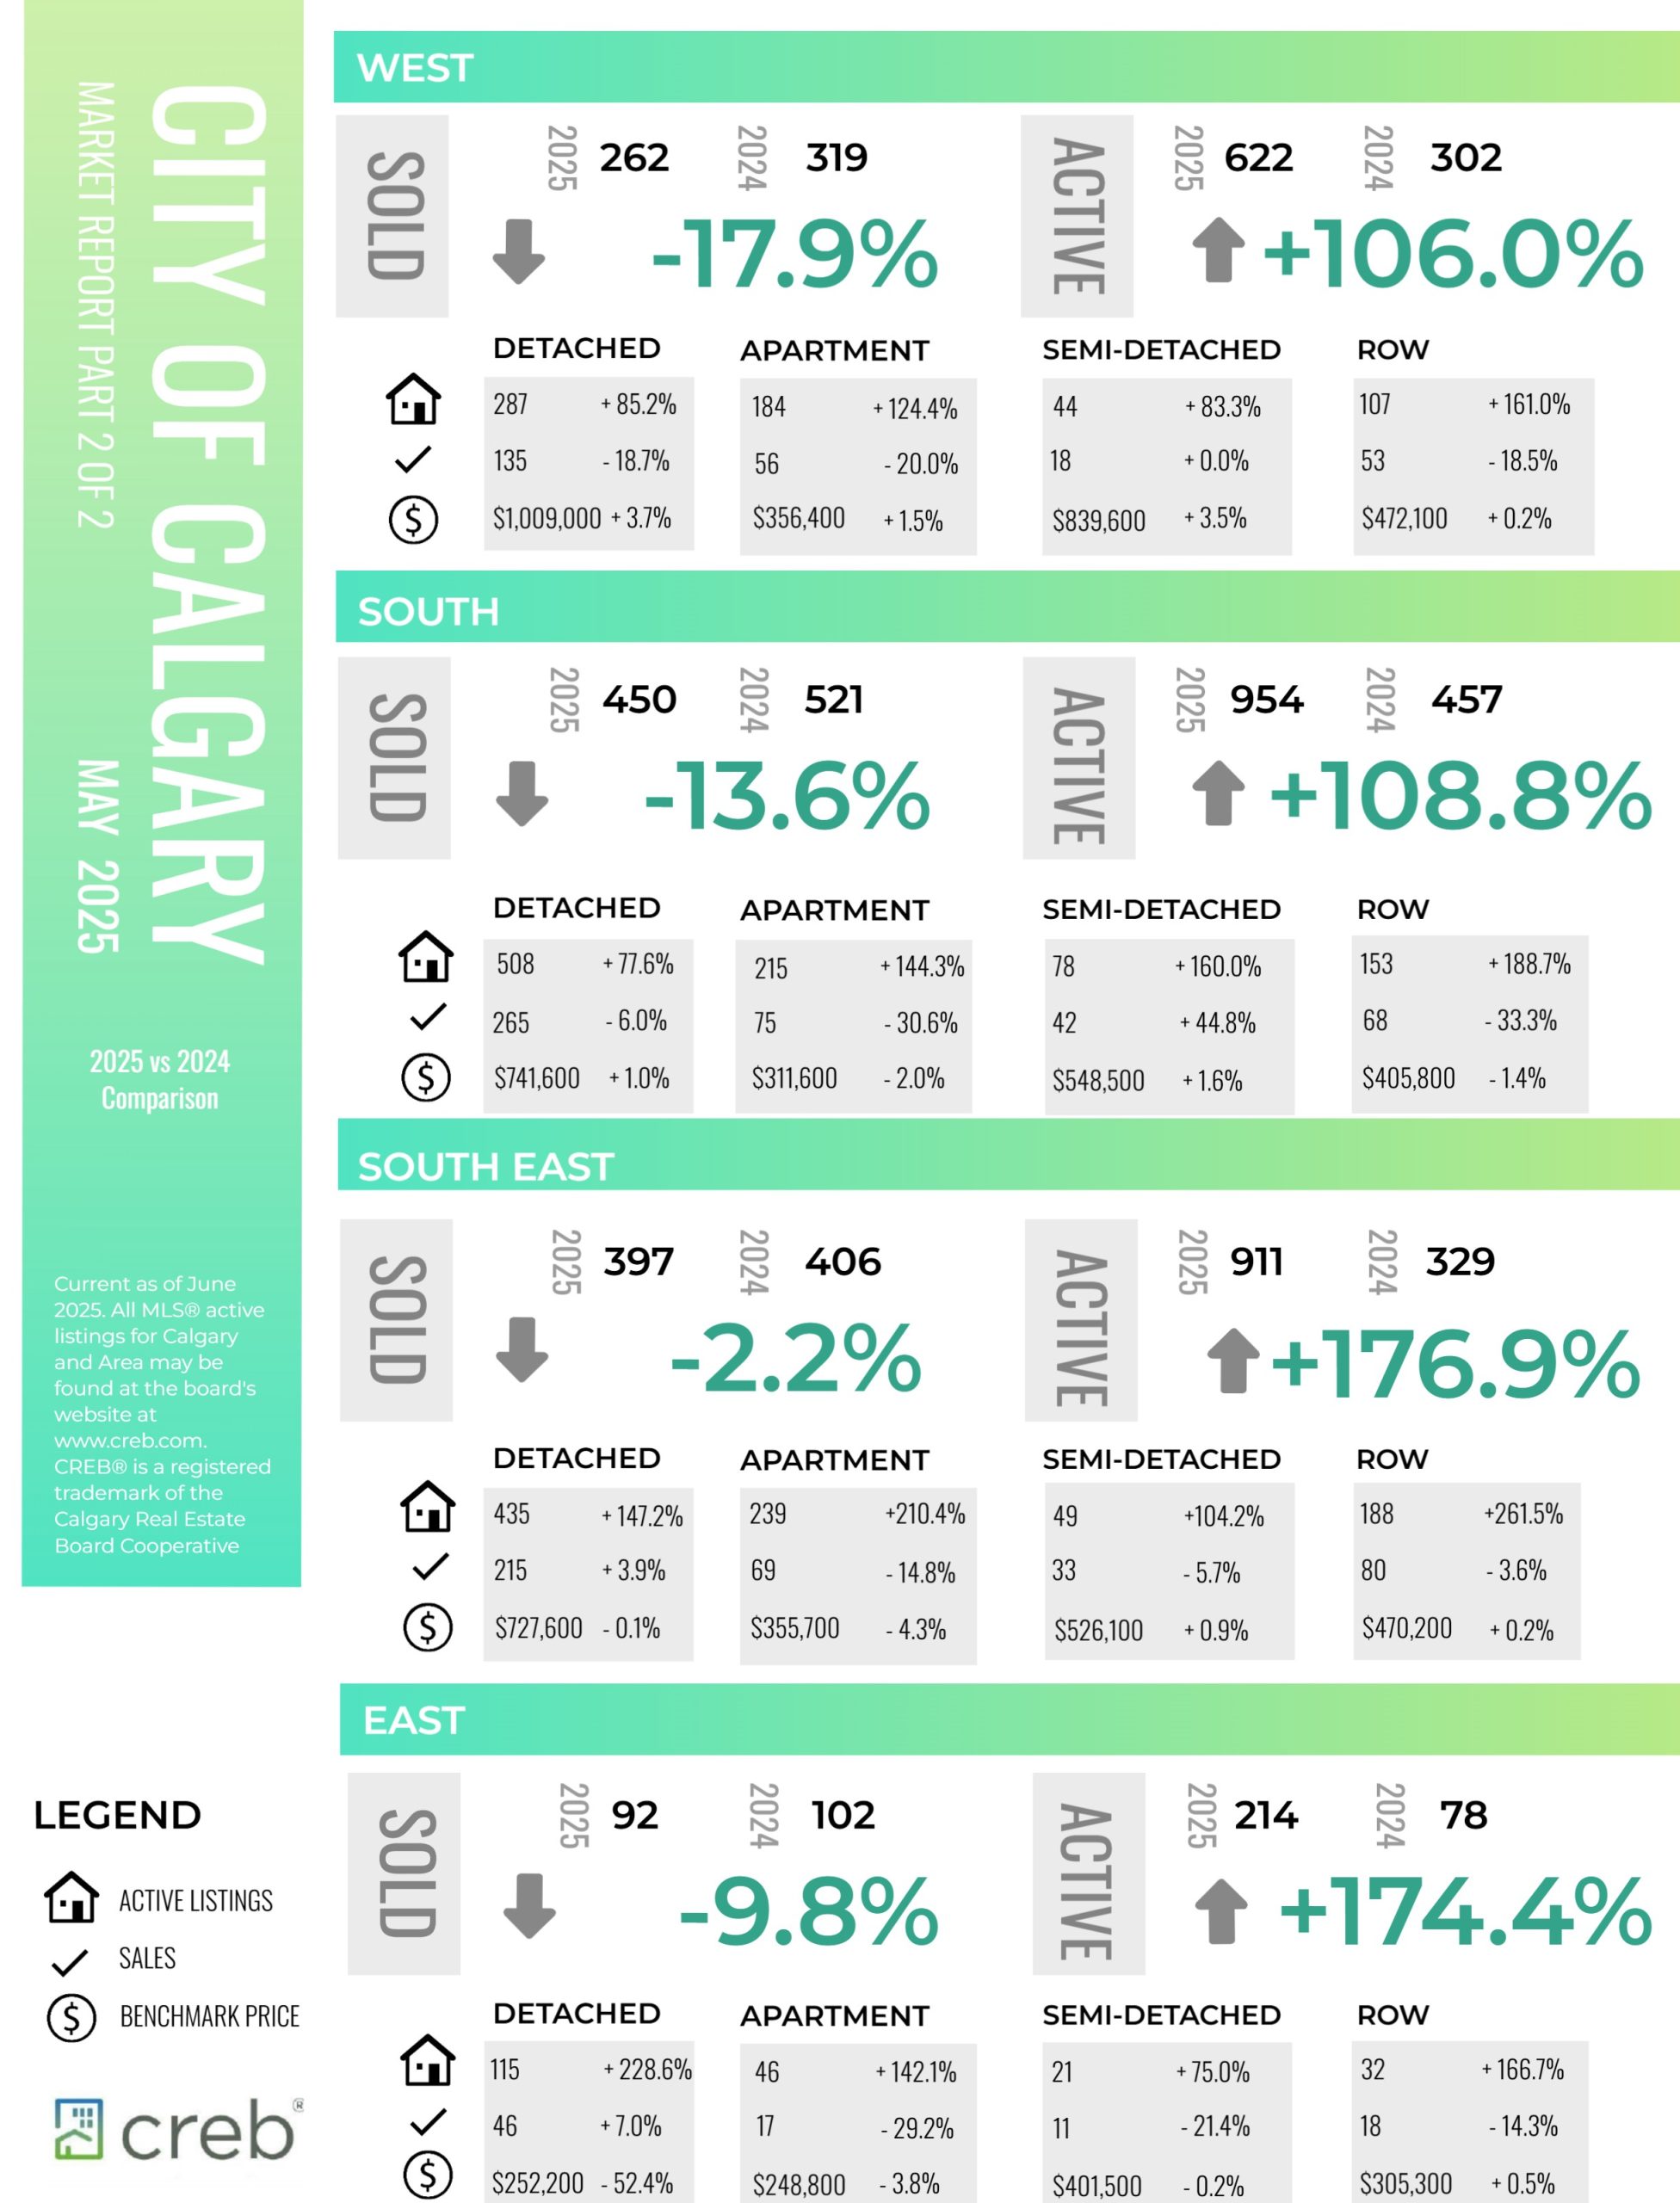
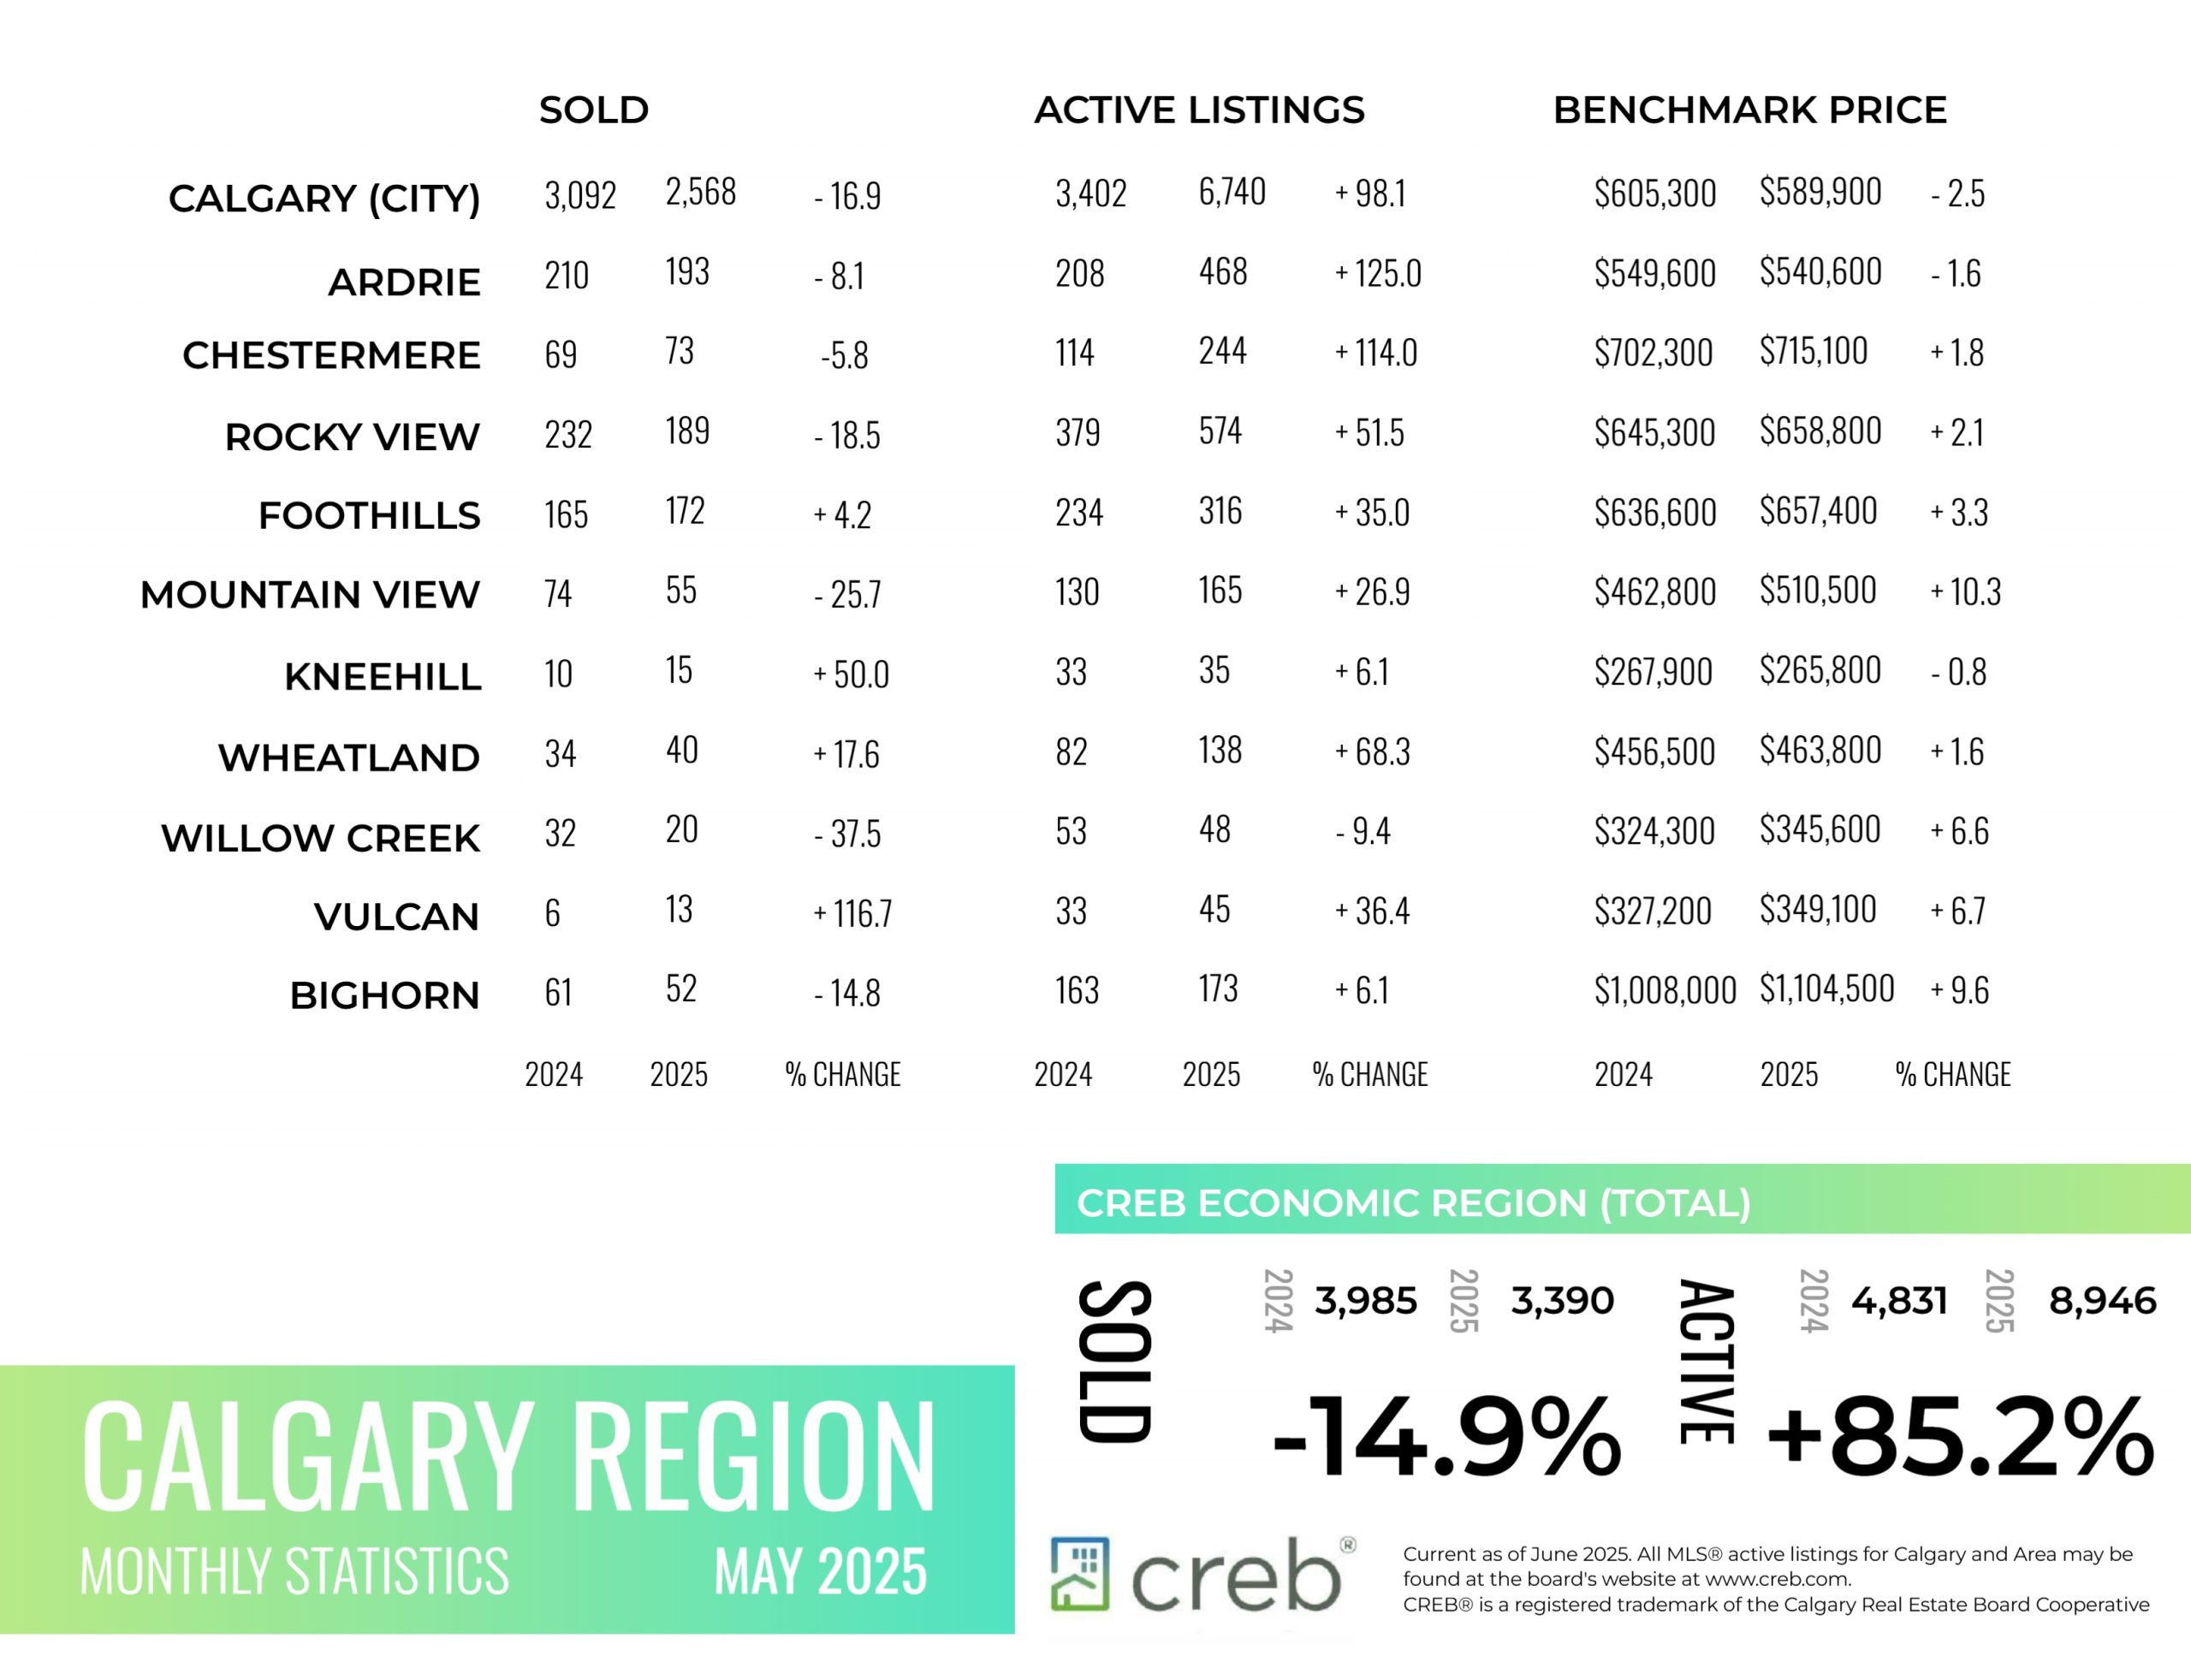
INFOGRAPHICS: May 2025 CREB City And Region Market Reports

Price adjustments mostly driven by apartment and row style homes
Thanks to steep pullbacks in the apartment condominium sector, total residential sales in Calgary eased by 17 per cent compared to May of last year. While the drop does seem significant, the 2,568 sales this month remain 11 per cent higher than long-term trends for May and improved over last month.
New listings continued to rise this month compared to sales, resulting in further gains in inventory levels. However, the monthly gain in both inventory and sales prevented any significant change in the months of supply compared to April. With 2.6 months of supply, conditions are still relatively balanced.
“Compared to last year, easing sales and rising inventories are consistent trends across many cities, as uncertainty continues to weigh on housing demand. However, prior to the economic uncertainty, Calgary was dealing with seller market conditions, and the recent pullbacks in sales and inventory have helped shift us toward balanced conditions taking the
pressure off prices,” said Ann-Marie Lurie, Chief Economist at CREB®. “This is a different situation from some of the other larger cities, where their housing markets were struggling prior to the addition of economic uncertainty.”
Read the full report on the CREB website!
The following data is a comparison between May 2025 and May 2024 numbers, and is current as of June of 2025. For last month’s numbers, check out our previous infographic.
Or follow this link for all our CREB Infographics!
Click on the images for a larger view!
Download Printable Version – May 2025 CREB, City of Calgary Report Pages 1 and 2
Download Printable Version – May 2025 CREB, Calgary Region Report
INFOGRAPHICS: April 2025 CREB City And Region Market Reports

Balanced conditions take pressure off prices
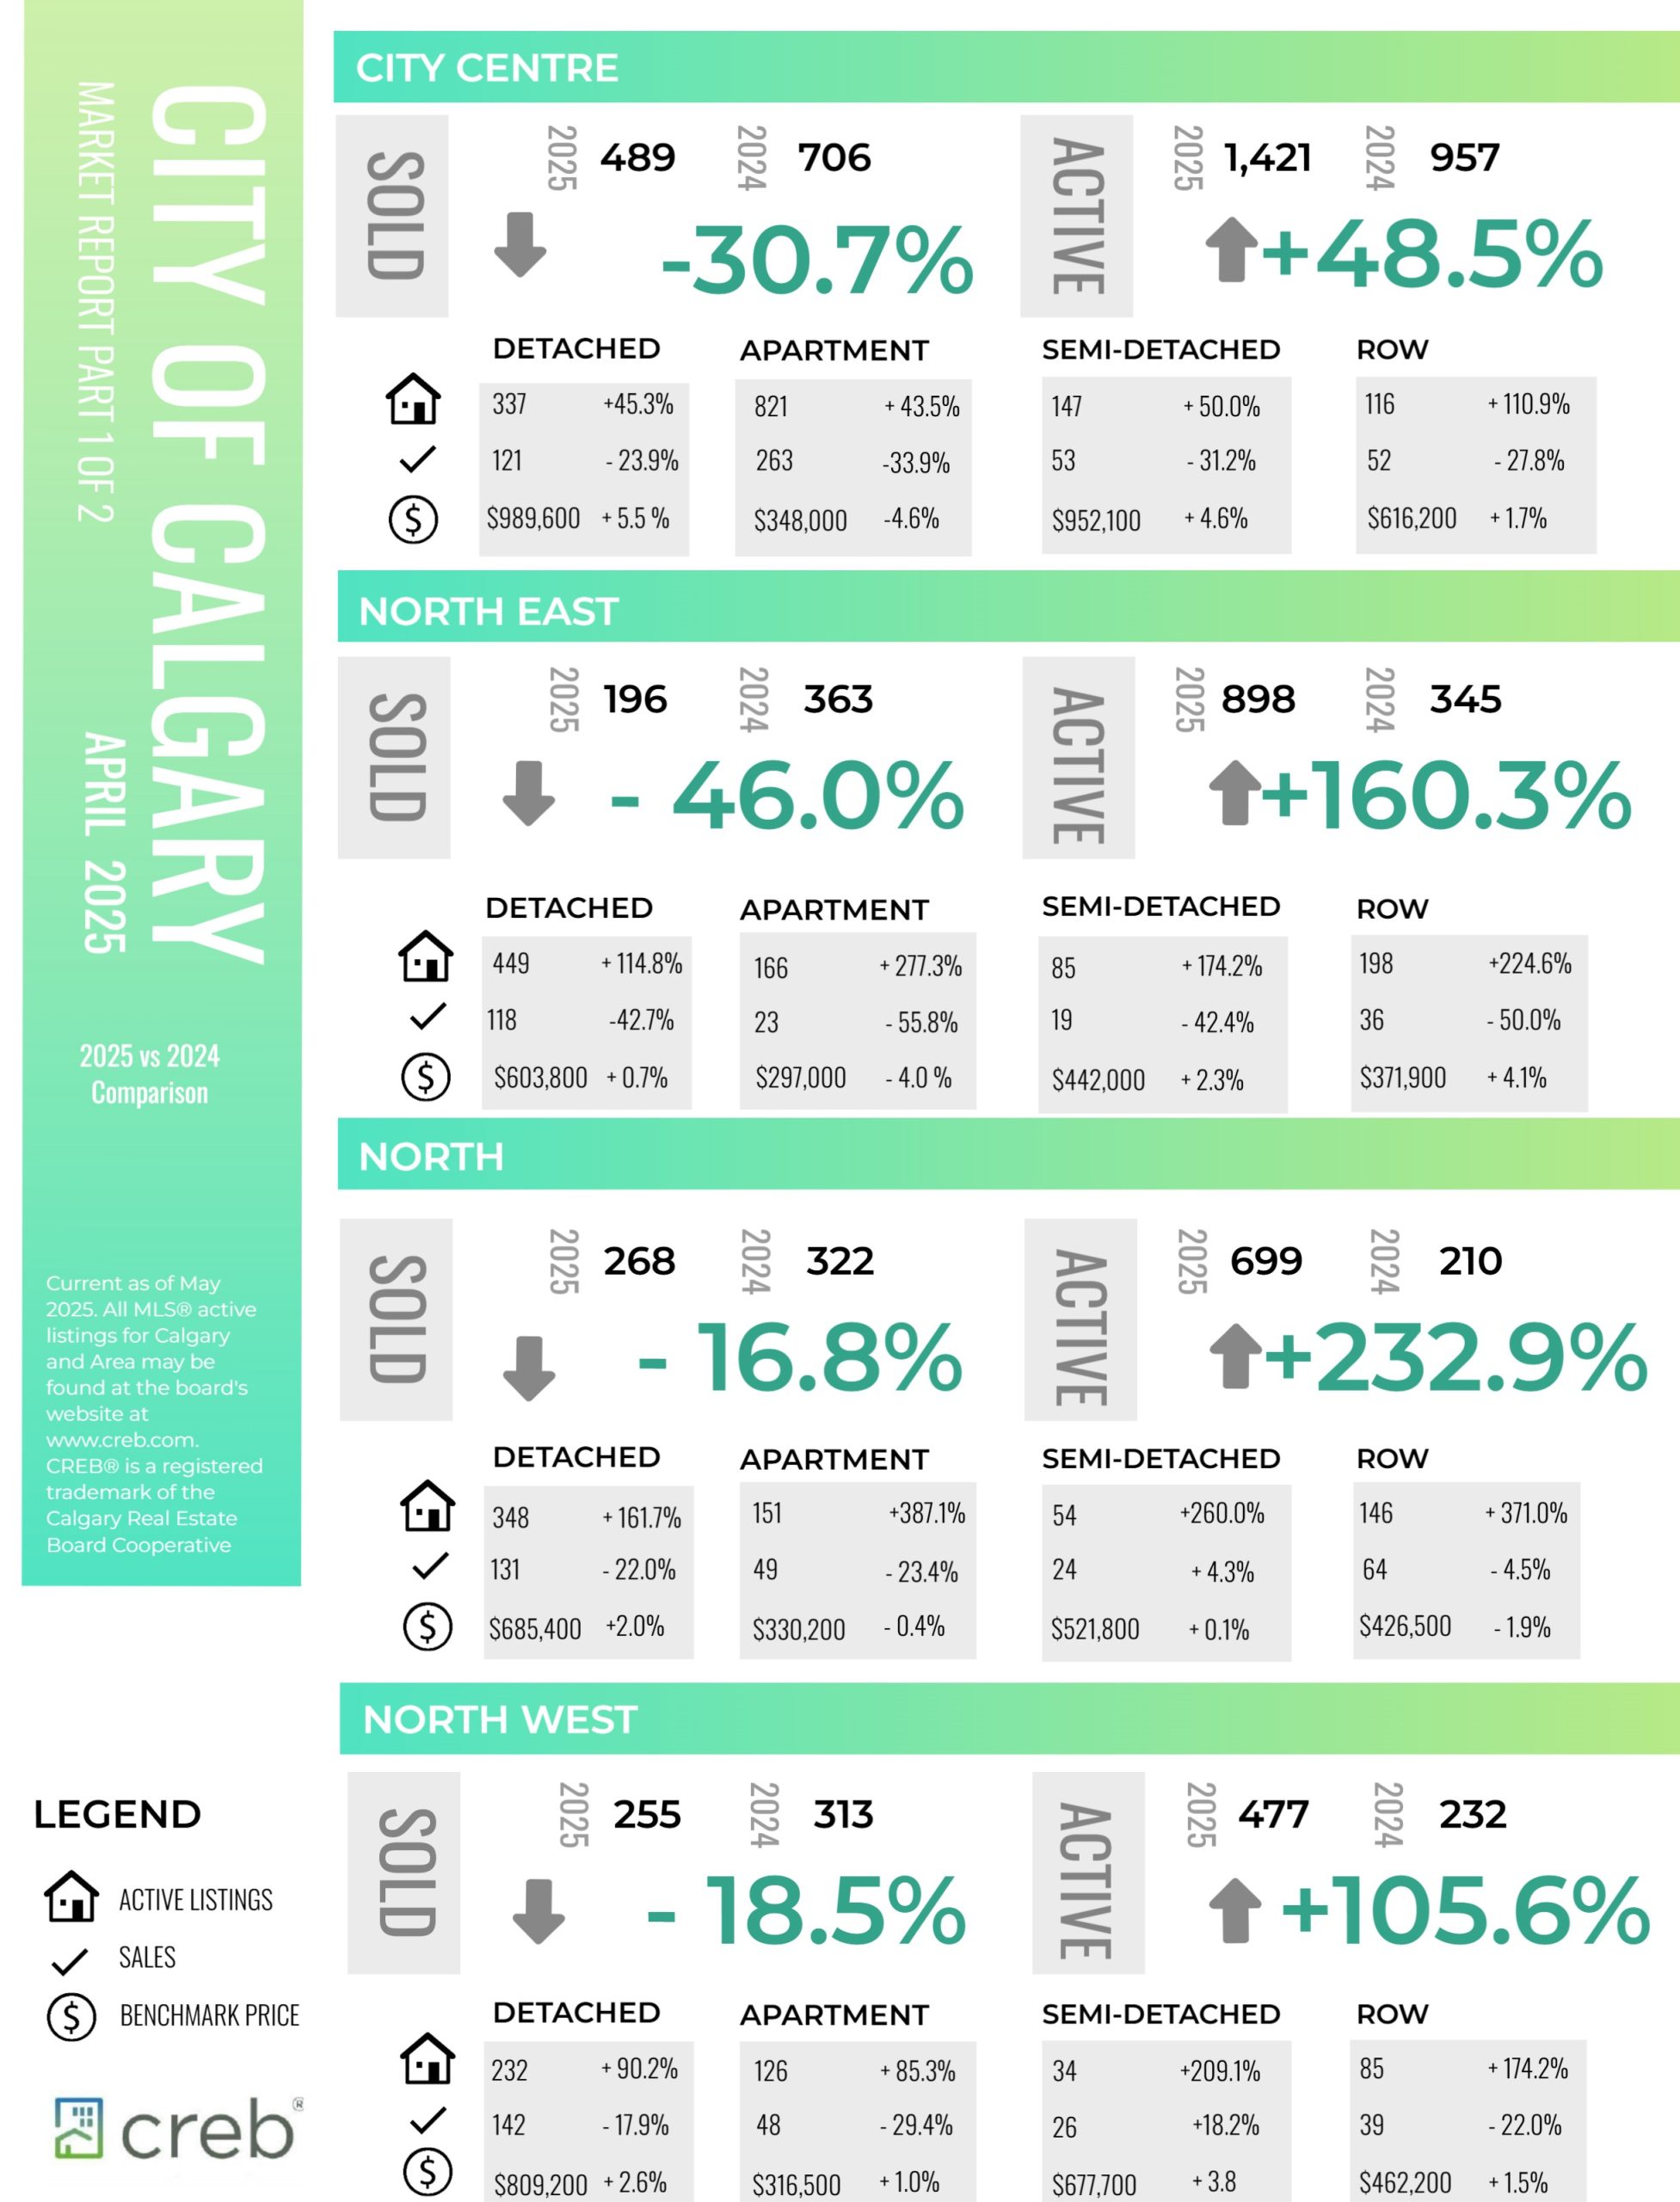
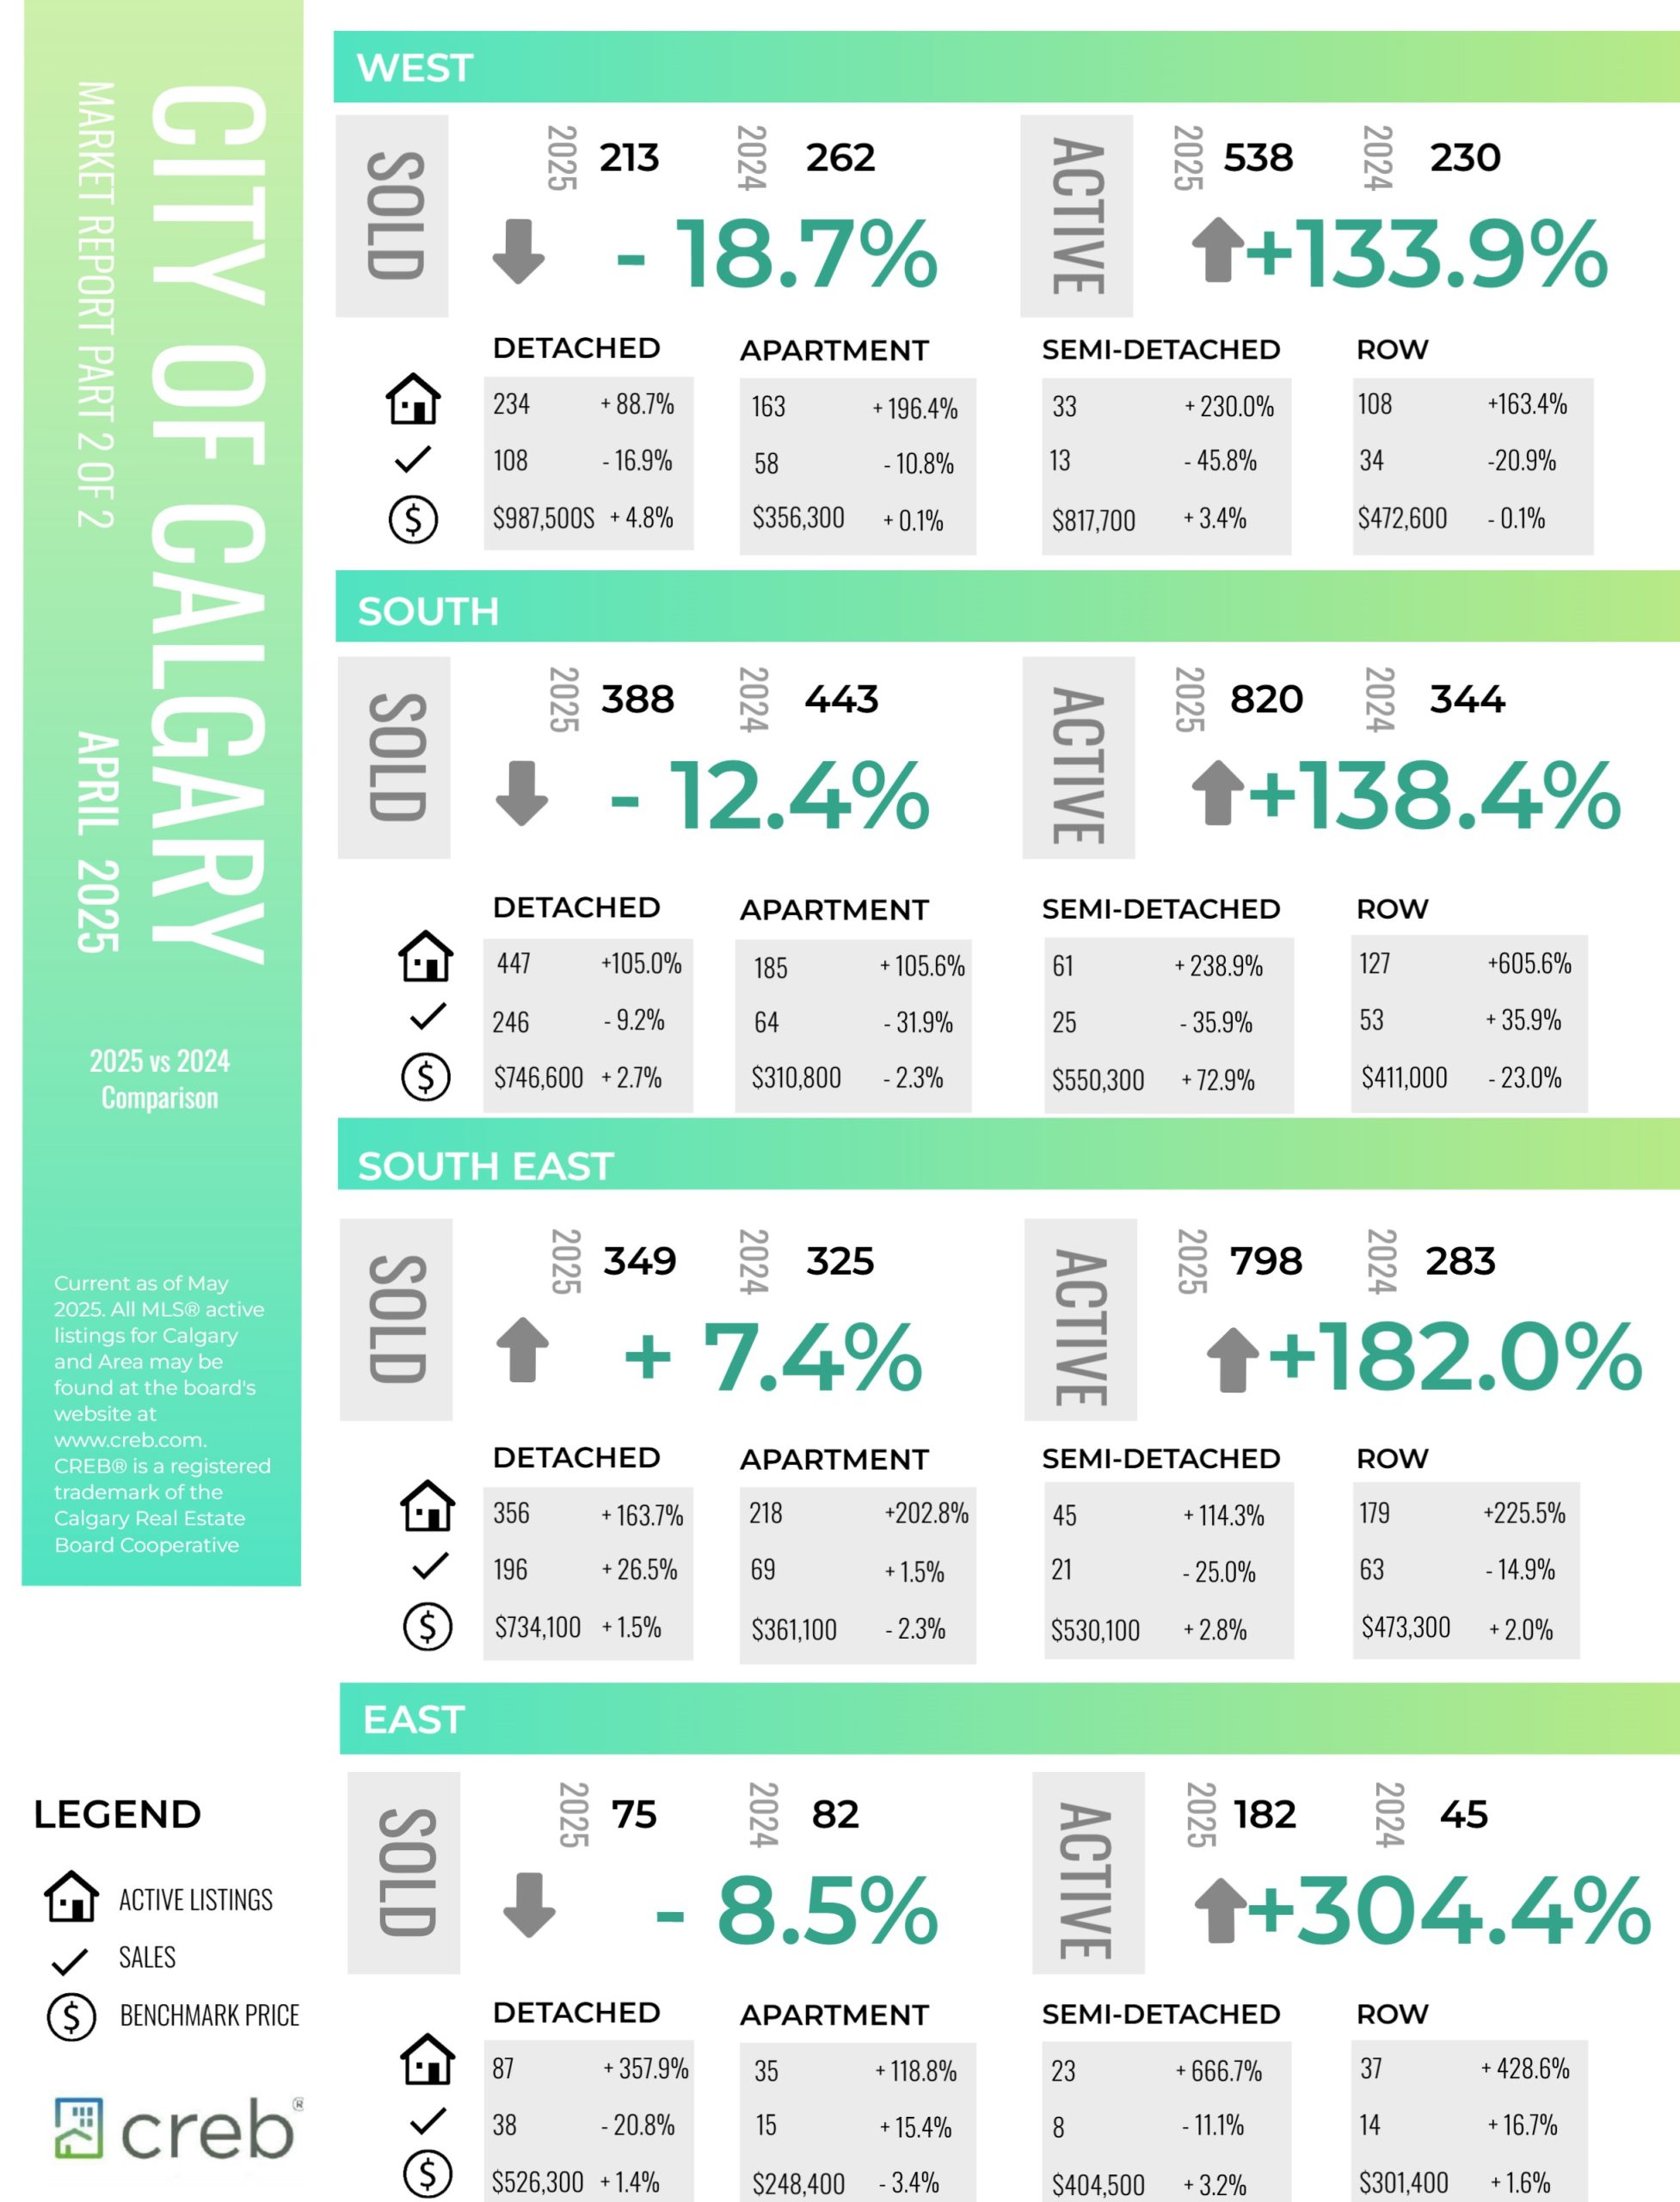
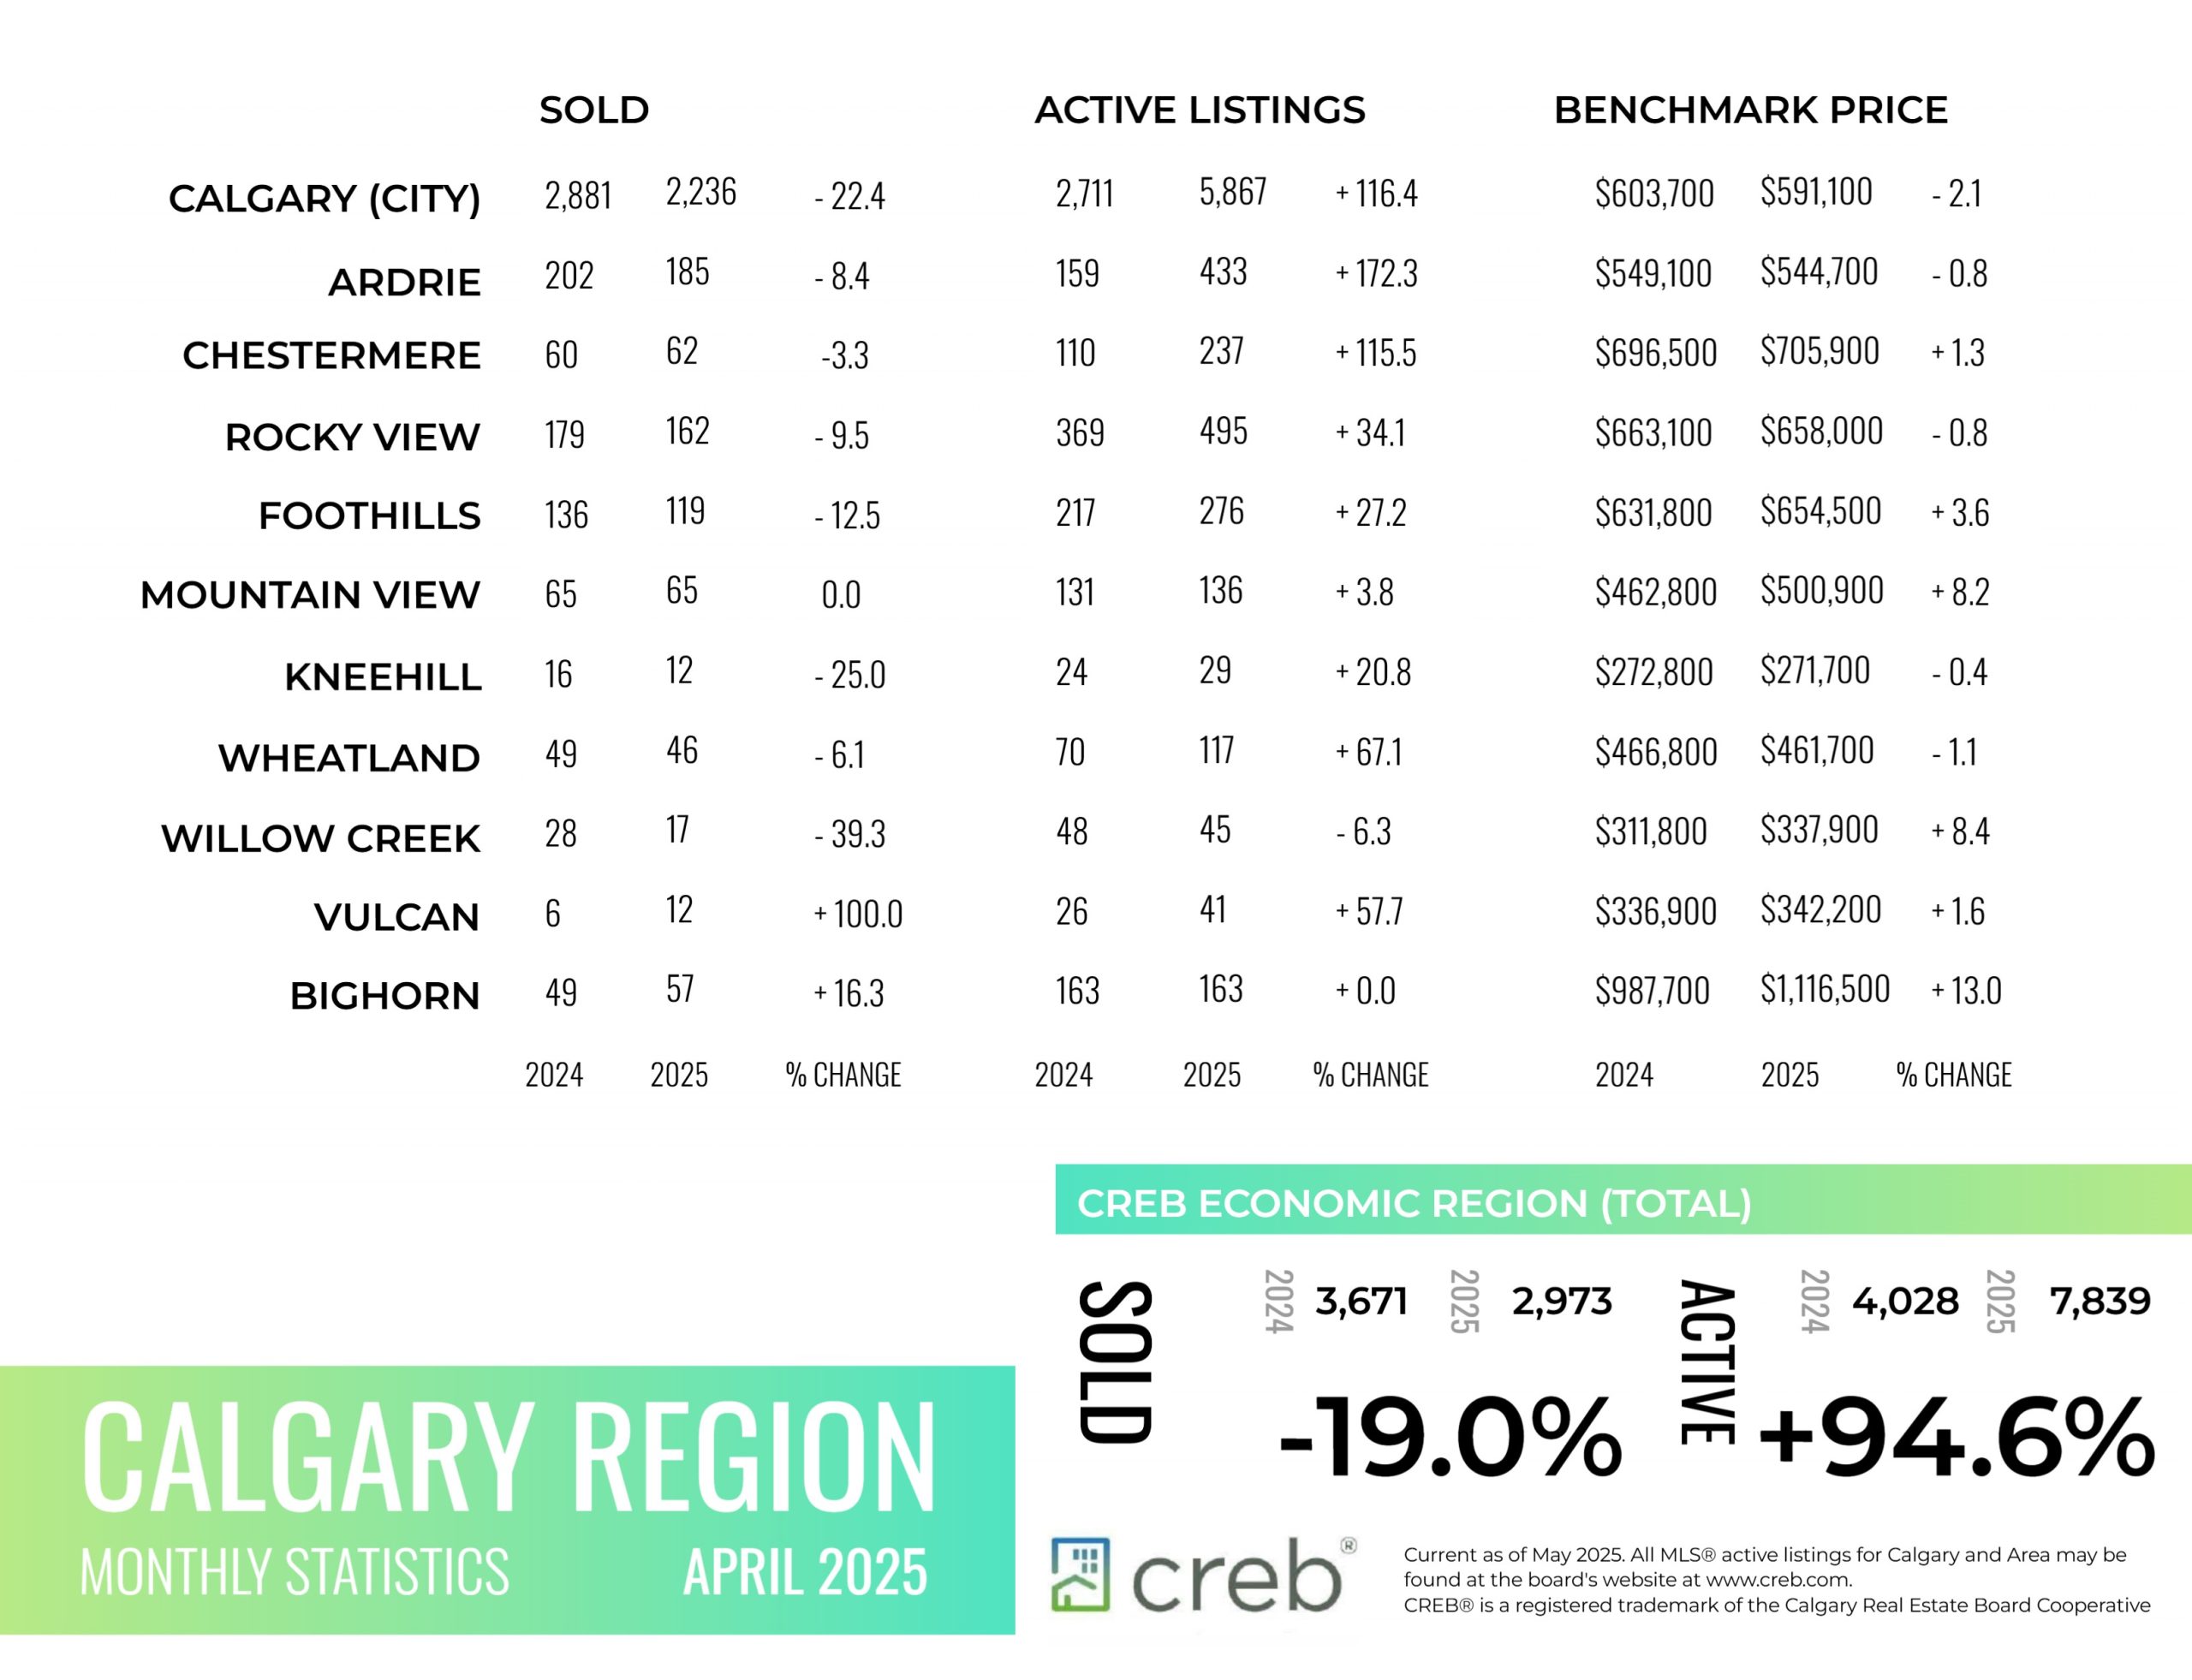
A boost in new listings this month relative to sales caused April inventories to rise to 5,876 units. While this is more than double the levels reported last year, supply last year was exceptionally low and current levels are consistent with levels we traditionally see in April. Sales in April reached 2,236 units, 22 per cent below last years levels but in line with long-term trends.
“Economic uncertainty has weighed on home sales in our market, but levels are still outpacing activity reported during the challenging economic climate experienced prior to the pandemic,” said Ann-Marie Lurie, Chief Economist at CREB®. “This, in part, is related to our market’s situation before the recent shocks. Previous gains in migration, relatively stable employment levels, lower lending rates, and better supply choice compared to last year’s ultra-low levels have likely prevented a more significant pullback in sales and have kept home prices relatively stable.”
Read the full report on the CREB website!
The following data is a comparison between April 2025 and April 2024 numbers, and is current as of May of 2025. For last month’s numbers, check out our previous infographic.
Or follow this link for all our CREB Infographics!
Click on the images for a larger view!
Download Printable Version – April 2025 CREB, City of Calgary Report Pages 1 and 2
Download Printable Version – April 2025 CREB, Calgary Region Report
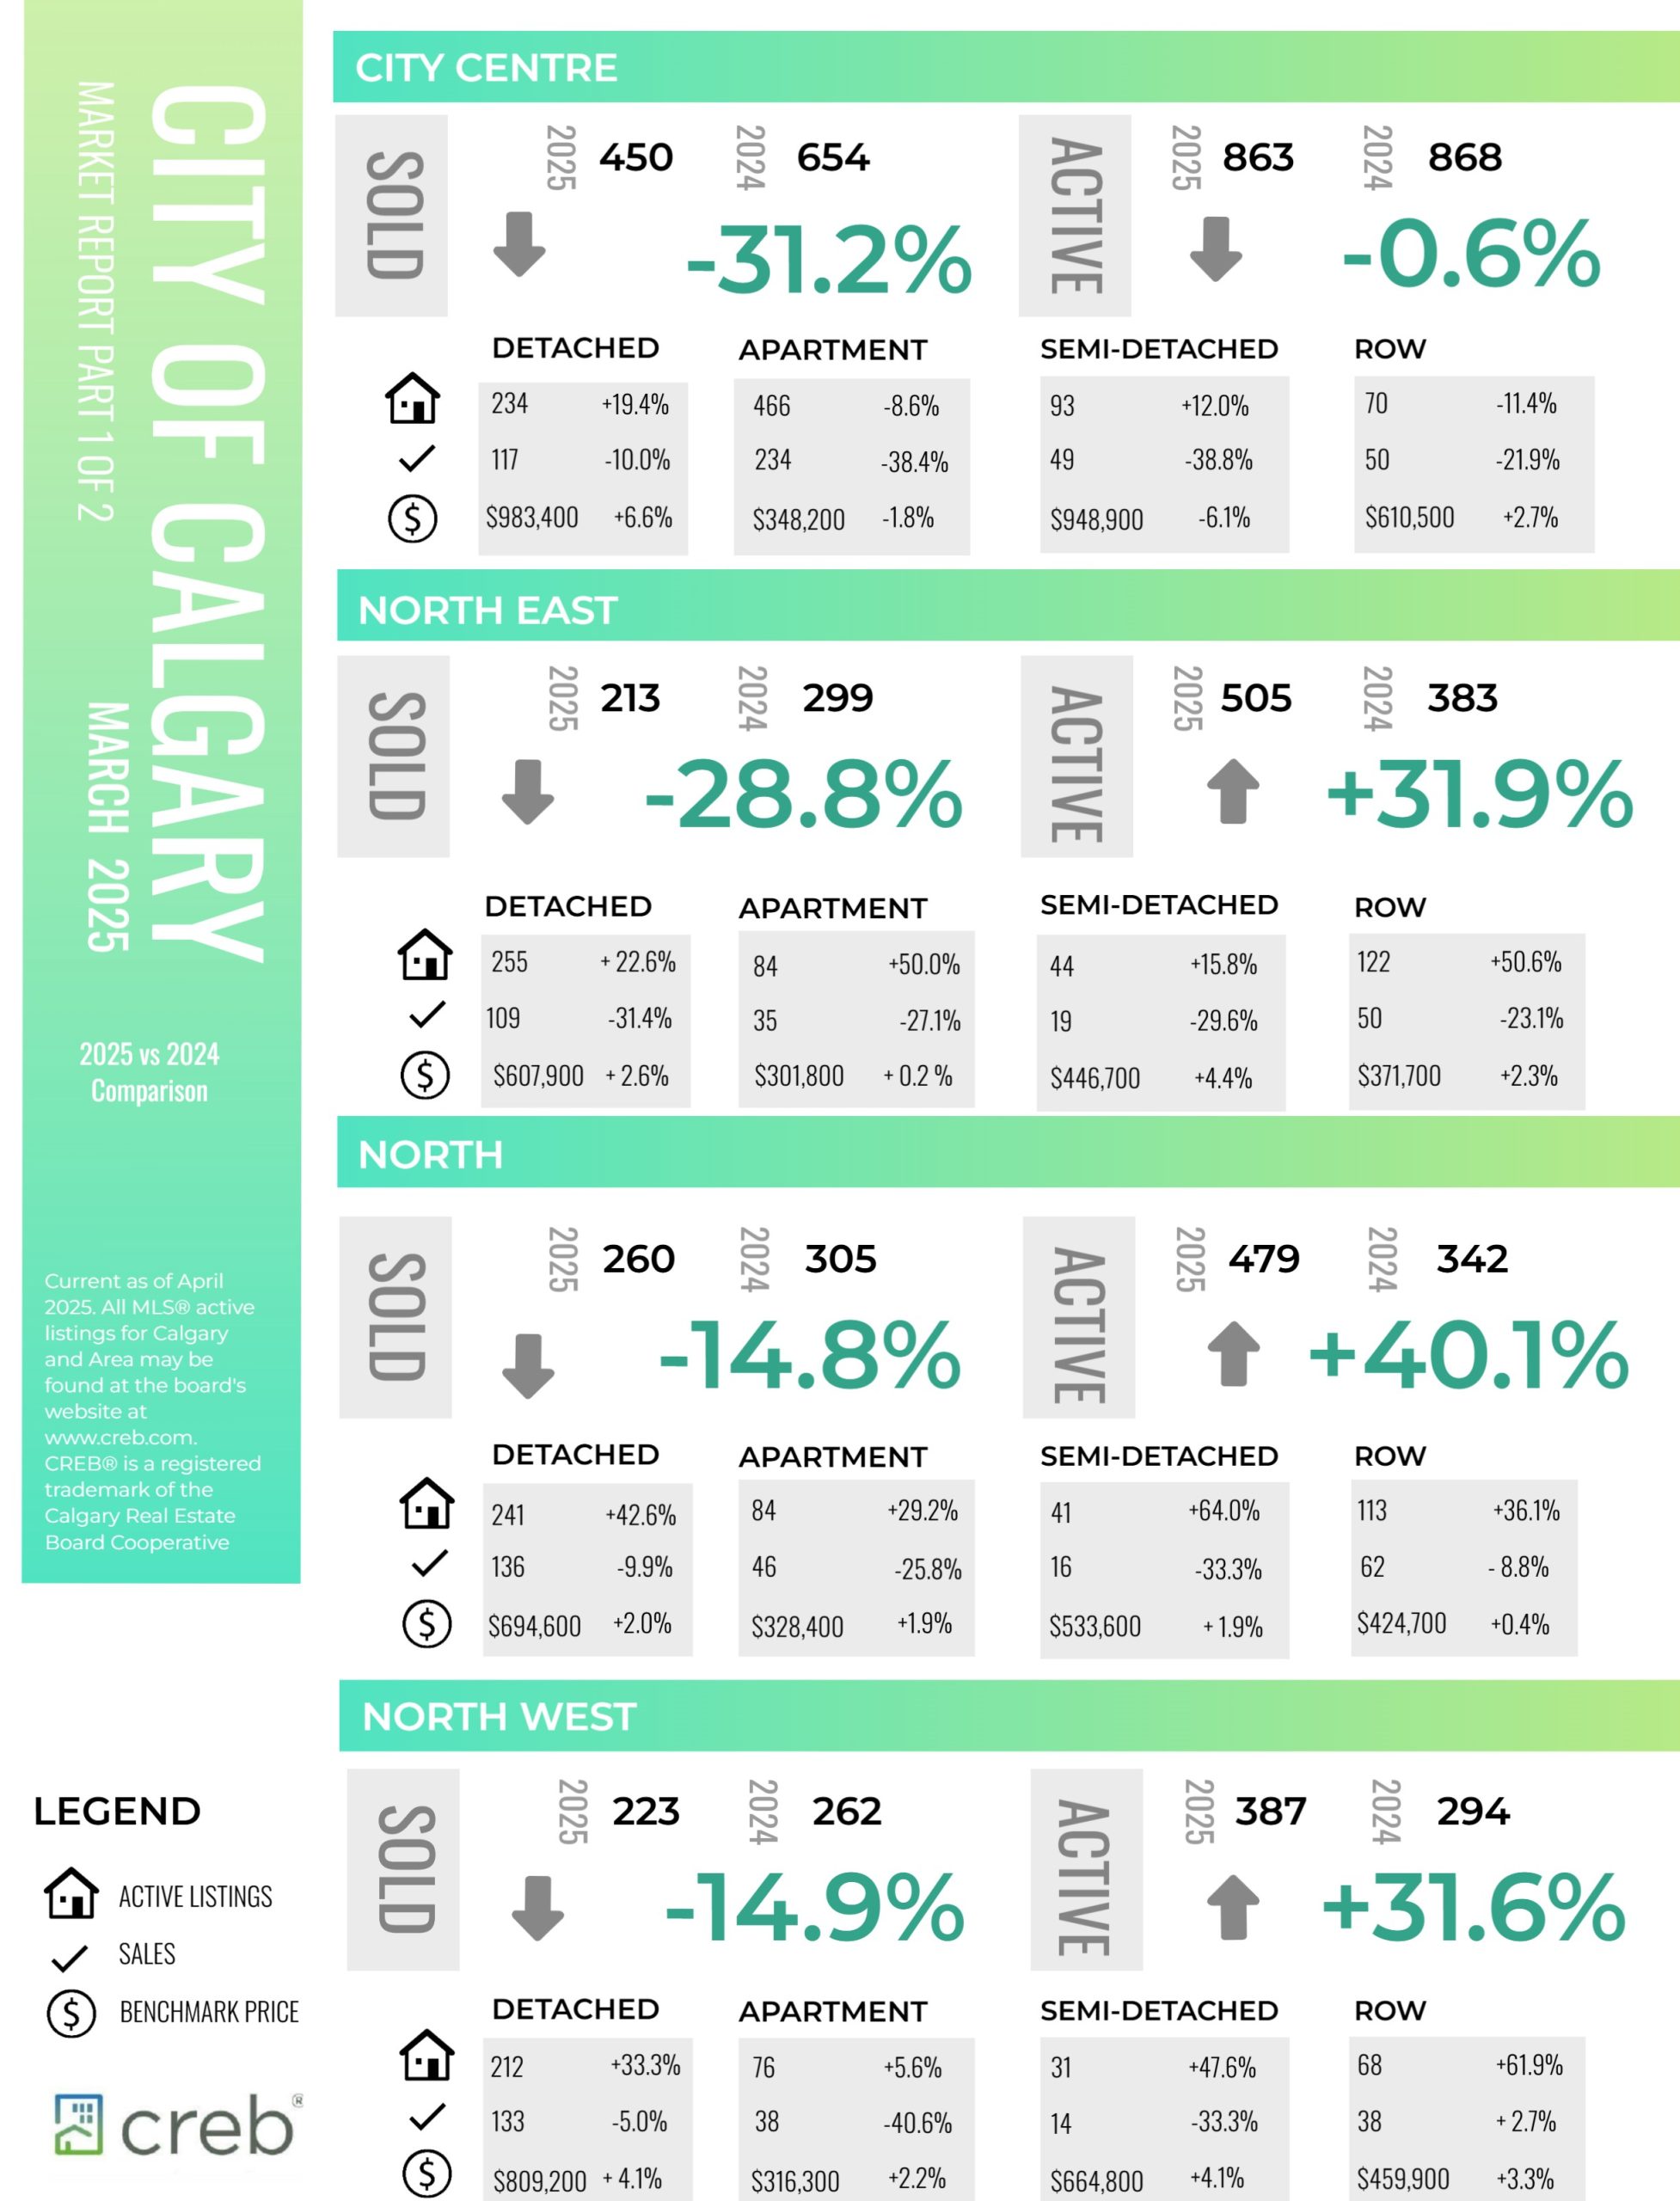
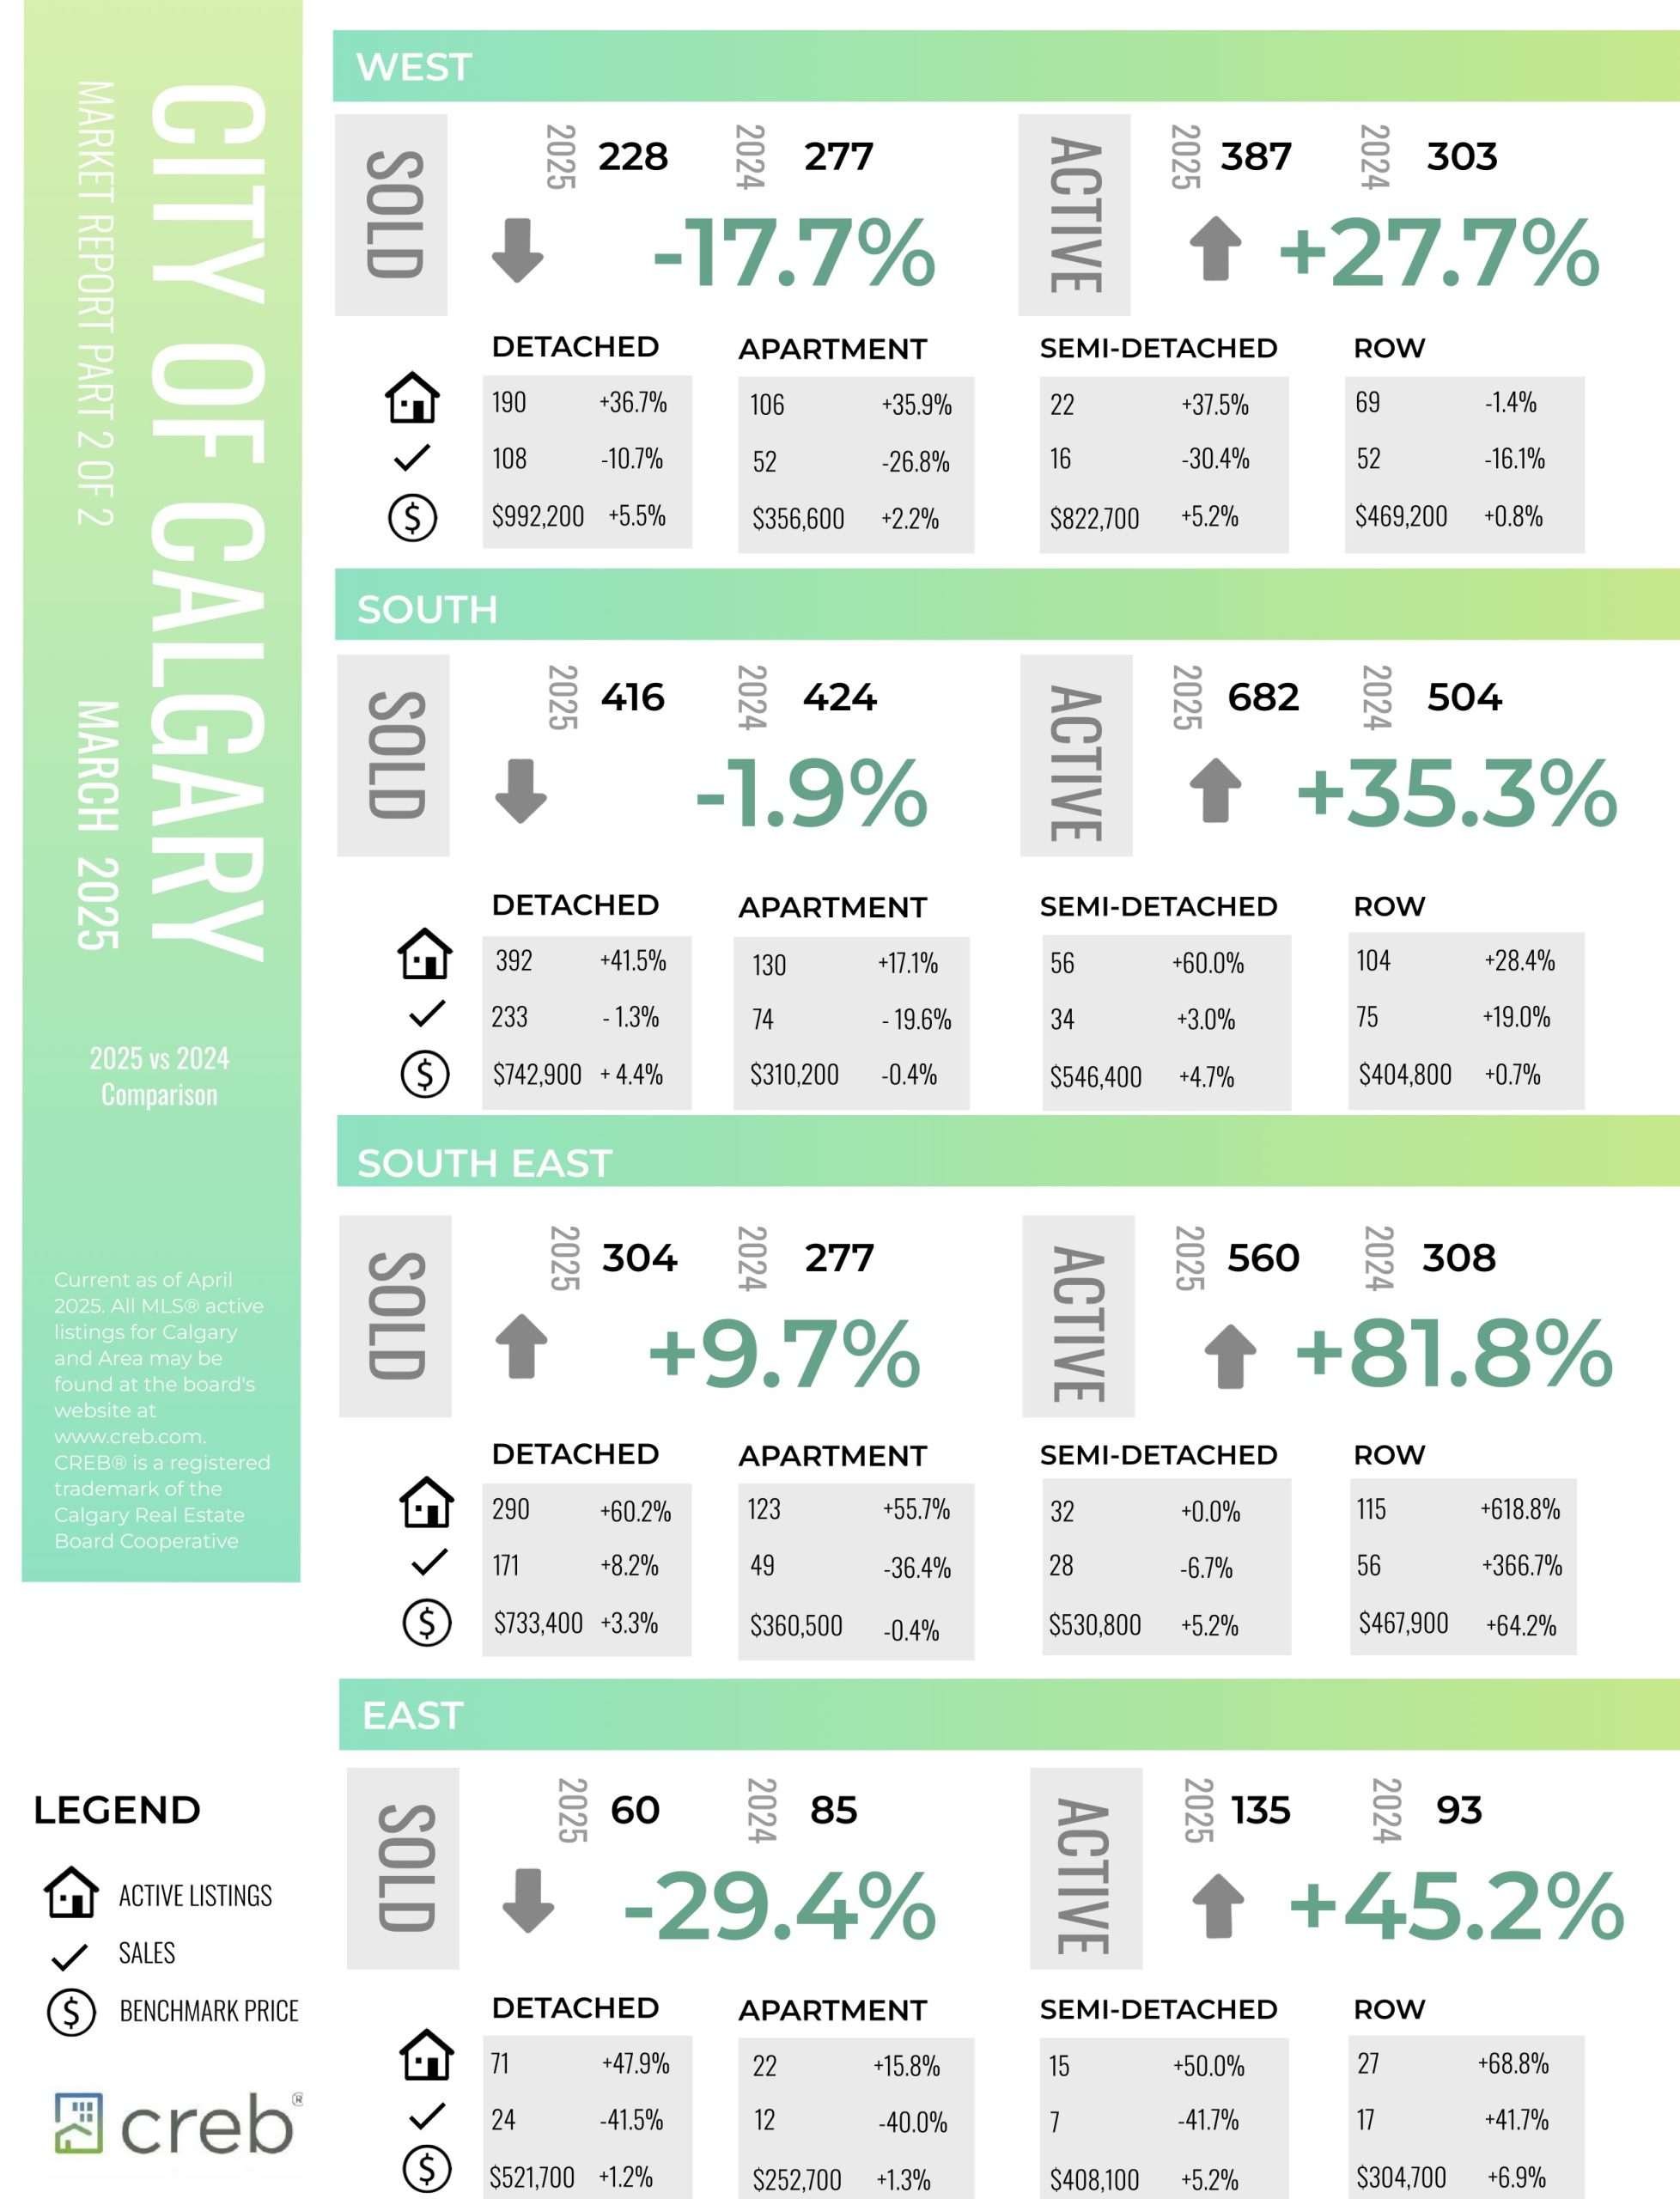
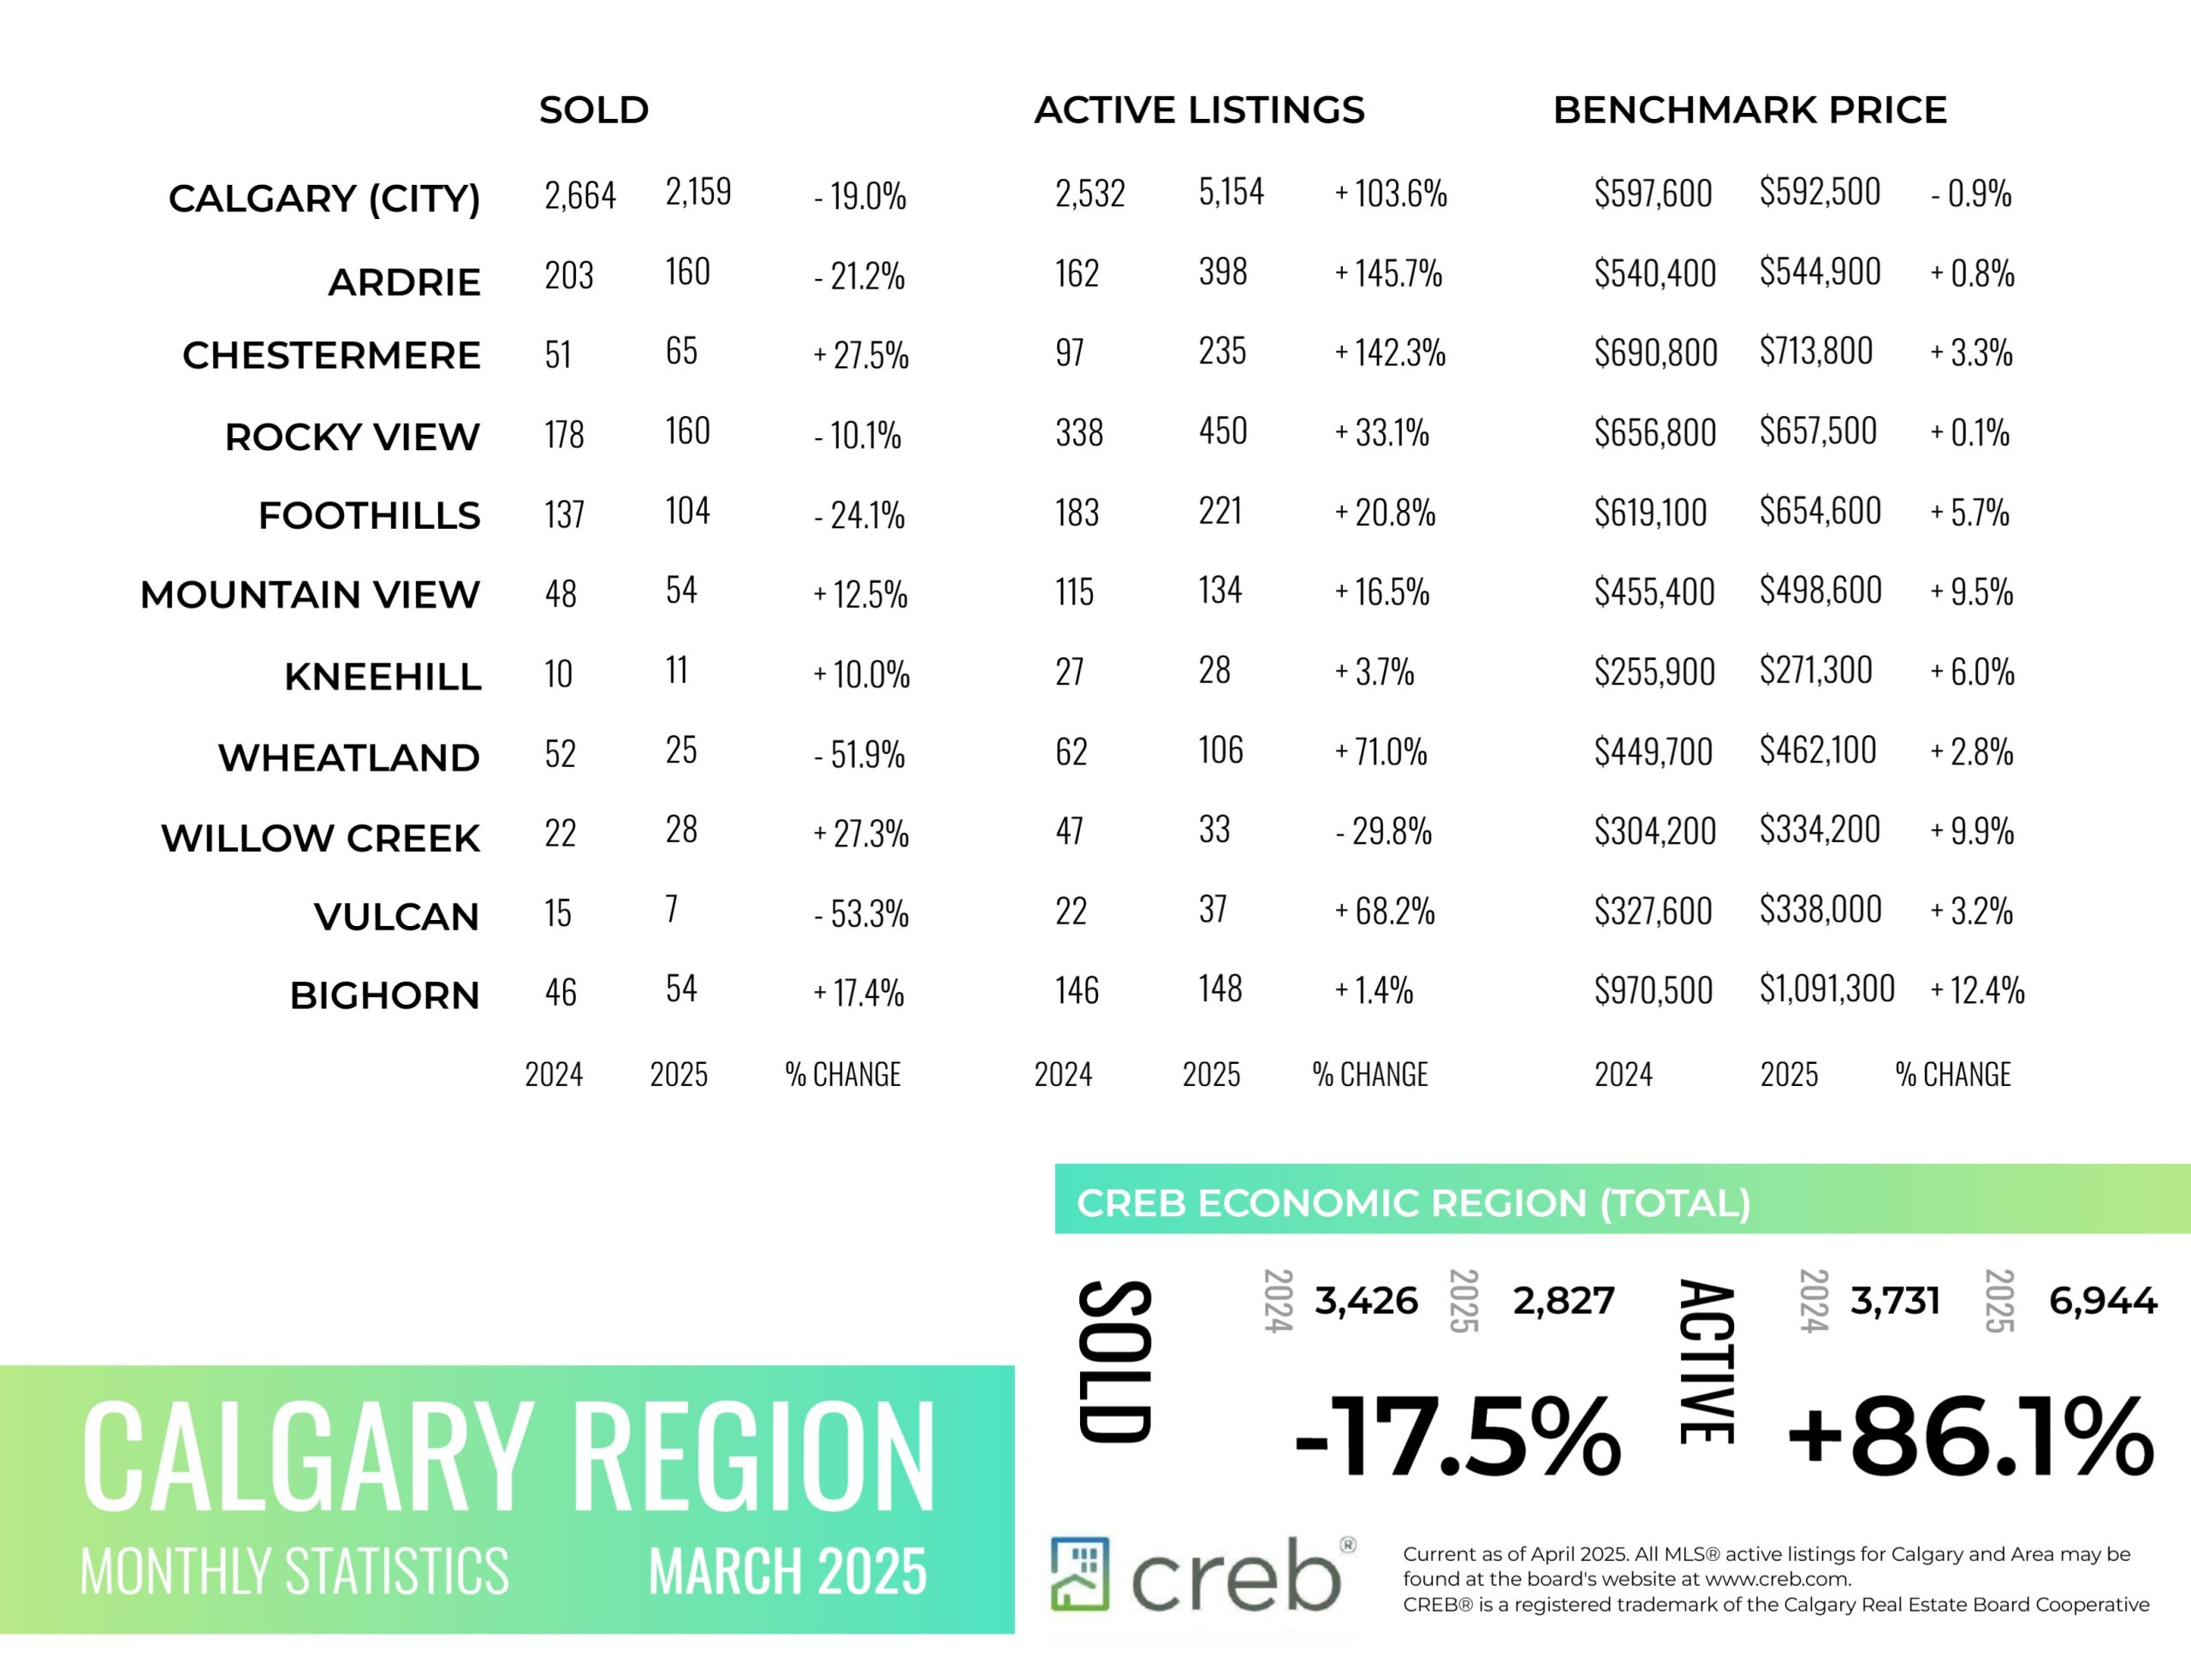
INFOGRAPHICS: March 2025 CREB City And Region Market Reports

Uncertainty weighing on housing market
Ongoing economic uncertainty, driven by tariff threats, has weighed on consumer confidence and impacted housing activity in March. Sales declined by 19 per cent year-over-year, totaling 2,159 units. Sales slowed across all property types, with the
steepest declines seen in higher-density segments.
“It is not a surprise to see a pullback in sales given the uncertainty,” said Ann-Marie Lurie, Chief Economist at CREB®. “However, it is important to note that sales still remain stronger than anything reported throughout 2015 to 2020, where our economy faced significant economic challenges and job loss. Nonetheless, easing demand has been met with gains in new listings and rising inventories, helping our market shift back toward balanced conditions, following four consecutive years where the market favoured the seller.”
March reported over 4,000 new listings, causing the sales-to-new-listing ratio to drop to 54 per cent, low enough to support further inventory gains. Total residential inventory levels reached 5,154 units, and the months of supply pushed up to 2.4 months. While this is a significant change from last year, with limited supply options across all property types and price ranges, conditions reflect a better balance between a seller and a buyer today. However, the market significantly varies depending on location, price point, and property type.
Read the full report on the CREB website!
The following data is a comparison between March 2025 and March 2024 numbers, and is current as of April of 2025. For last month’s numbers, check out our previous infographic.
Or follow this link for all our CREB Infographics!
Click on the images for a larger view!
Download Printable Version – March 2025 CREB, City of Calgary Report Pages 1 and 2
Download Printable Version – March 2025 CREB, Calgary Region Report
